










Executive Overview
For years, clean-energy analysts have relied on a comforting and historically proven rule of thumb: the experience curve. Borrowed from the meteoric trajectories of solar photovoltaics and lithium-ion batteries, this empirical framework dictates that every time cumulative global deployment doubles, capital costs decline by a predictable percentage. By compounding these learning rates forward, forecasters have painted a picture of an inevitable, steeply plunging cost curve for green hydrogen, promising an era where cheap renewable molecules will effortlessly decarbonize heavy industry, shipping, and aviation.
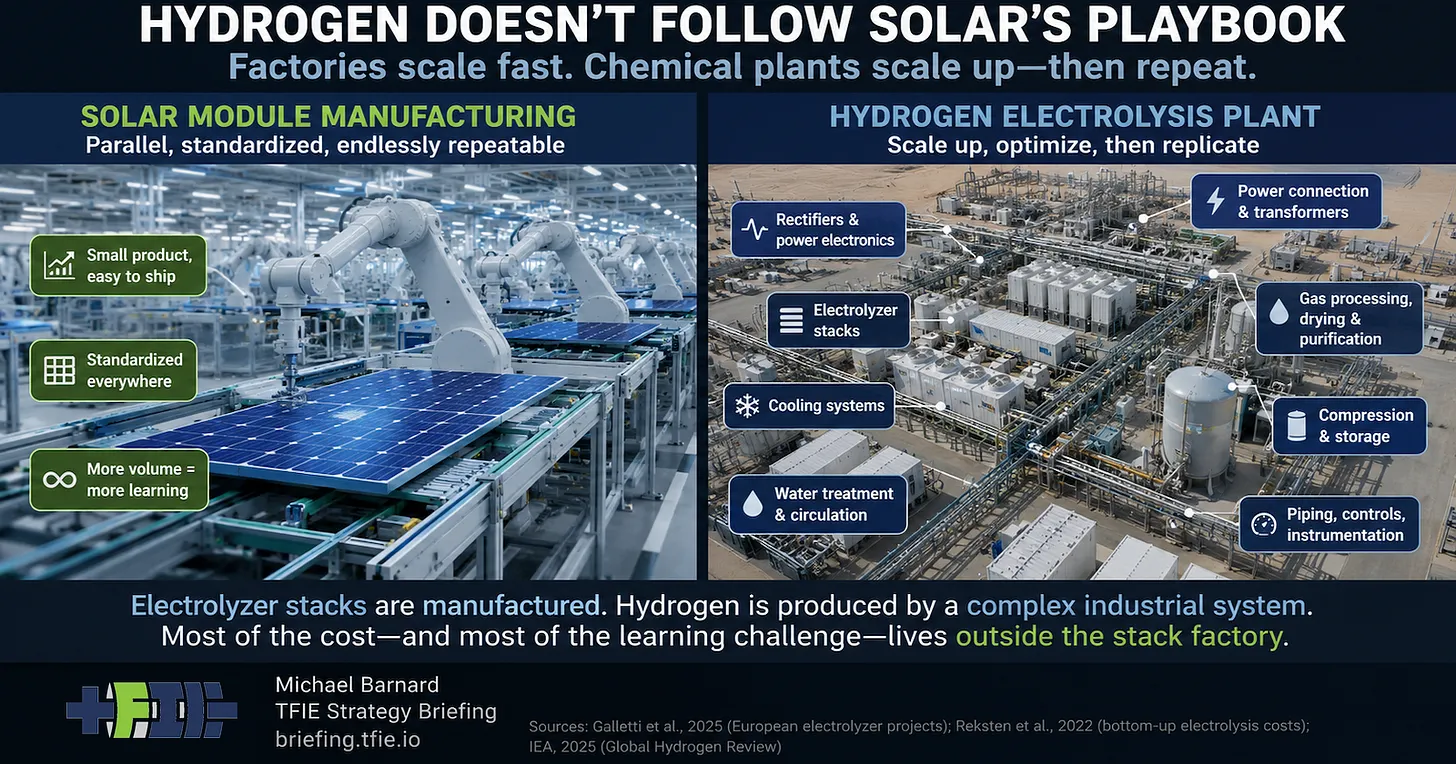
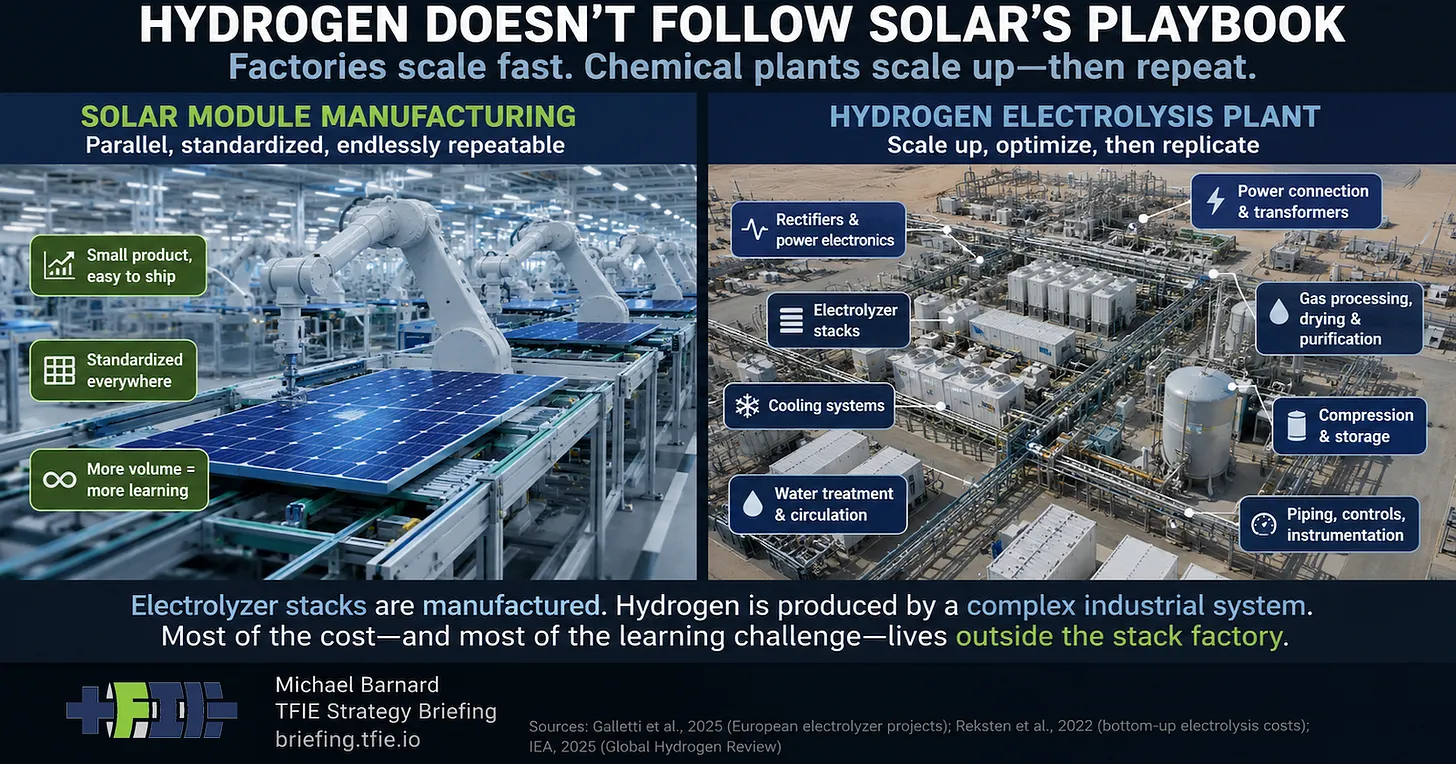
However, a fundamental disconnect has emerged between the spreadsheet models and reality. While electrolyzer stacks are manufactured in factories, complete hydrogen plants must be engineered, constructed, and operated in the field. The vast majority of the apparent learning challenge—and the lion’s share of total project costs—lives entirely outside the stack factory doors.
Recent empirical data, highlighted by a comprehensive 2025 European electrolyzer-project study, reveals that raw cost-reduction curves have been grossly misleading. By attributing capital expenditure (CAPEX) drops to "learning by doing," traditional forecasting tools have conflated true manufacturing experience with disparate phenomena, such as front-loaded chemical-plant economies of scale and physical plant upscaling. When these factors are normalized, the true rate of cost reduction plummets.

To chart a realistic path forward for the hydrogen economy, industry stakeholders must dismantle these flawed assumptions. A defensible hydrogen forecast cannot treat a massive chemical facility like a mass-produced consumer electronic; it must meticulously isolate manufacturing efficiency from chemical-plant design, balance-of-plant logistics, electricity input costs, and baseline infrastructure constraints.
Detailed Chronology: The Evolution of Hydrogen Cost Forecasting
To understand where modern hydrogen economics went awry, it is necessary to trace how analysts applied lessons from adjacent clean-tech sectors to an entirely different industrial beast.
The Solar and Battery Blueprint (Pre-2020)
In the 2010s, as solar modules and lithium-ion battery packs witnessed unprecedented, exponential cost declines, policy makers and economists searched for the next great scaling miracle. Solar panels benefited from a straightforward mass-manufacturing paradigm: identical silicon wafers were produced by the millions in automated factories, creating a direct line between cumulative gigawatts produced and unit-cost reduction. Batteries followed a similar trajectory, driven by gigafactory-scale chemical synthesis and assembly.
When green hydrogen emerged as a central pillar of net-zero transition strategies, analysts naturally reached for the same experience curves. They observed that electrolyzer capacity needed to scale by orders of magnitude, and they applied historical solar learning rates (often assuming a 20% cost reduction per capacity doubling) directly to green hydrogen projections out to 2030, 2050, and beyond.

The Decoupling of Stacks and Systems (2020–2024)
As governments poured billions into green hydrogen subsidies—such as the US Inflation Reduction Act and the European Hydrogen Bank—developers began breaking ground on commercial-scale projects. Early real-world data quickly exposed a crack in the theoretical foundation. While stack manufacturers successfully automated production lines and improved current densities, the total installed cost of complete green hydrogen projects refused to drop at the expected rate.
Industry veterans pointed out an elementary truth: an electrolyzer stack is only one component of a sprawling chemical facility. Power electronics, gas purification units, massive water-treatment systems, high-pressure compressors, and civil engineering works comprised the majority of the capital expenditure. These systems did not share the automated, high-volume manufacturing characteristics of solar cells.
The 2025 European Electrolyzer Study and the Awakening
A landmark 2025 European study analyzing project capital costs and capacity data stretching back to 2005 provided the mathematical proof that the industry’s cost assumptions were flawed. Initially, the raw data appeared to validate traditional optimism: costs fell by 23.3% across all projects, 32.1% for Proton Exchange Membrane (PEM) systems, and 22.9% for alkaline electrolysis for every doubling of cumulative installed capacity.
However, when the researchers normalized project costs to account for estimated project-size economies—adjusting for the fact that newer projects were simply built much larger than older ones—the learning rates collapsed. Normalized cost reductions fell to 13.3% for PEM and 7.3% for alkaline systems, with the latter dropping below statistical significance. The raw curves had been falsely crediting "learning" for what was actually just the natural commercial advantage of building bigger industrial plants.
Supporting Context & Metrics: Deconstructing the Math
To build accurate financial models for clean hydrogen, analysts must dissect three distinct variables that traditional experience curves obscure: chemical-plant scale economies, stack-size inflation, and system boundary realities.
1. Front-Loaded Chemical-Plant Scale Economies
Unlike a solar farm, which is essentially an aggregation of identical modular panels, a hydrogen plant is a complex chemical facility governed by the laws of chemical engineering. These facilities enjoy substantial, but heavily front-loaded, economies of scale.
Consider the infrastructure required to build a facility:
- A 100-megawatt (MW) hydrogen plant does not require one hundred times the compressors, transformers, water-treatment systems, or engineering hours of a 1-MW plant.
- Larger projects share common equipment, spread fixed engineering costs across a vastly larger output, and allow auxiliary systems to reach their economically optimal sizes.
This creates a dramatic one-time cost drop as the industry transitions from small, bespoke demonstration projects (in the 1-to-10 MW range) to properly scaled industrial facilities (100+ MW). However, once core process equipment like compressors and transformers reach practical industrial scale, further capacity expansion comes primarily from replicating these standardized process trains. The next plant benefits from better procurement and experienced contractors, but it does not repeatedly capture the radical savings of moving out of demonstration scale.
2. The Denominator Problem: Gigawatts vs. Stack Count
A critical flaw in using cumulative gigawatts (GW) as the sole denominator for "experience" is the shifting physical architecture of electrolyzer stacks.
Imagine global cumulative electrolysis capacity rises from 5 GW to 50 GW—a tenfold increase representing 3.32 doublings of installed capacity.
- If the average finished stack size remains constant at 1 MW, the completed stack count also rises tenfold (from 5,000 to 50,000 units). In this scenario, capacity doublings and stack-count doublings track one another perfectly.
- However, if the average stack size increases from 1 MW to 5 MW during that same expansion phase, only 10,000 stacks are required to hit the 50 GW mark. While installed capacity still records 3.32 doublings, the actual number of manufactured stacks has doubled only once.
While the factory is undoubtedly gaining operational experience, the rate of physical manufacturing repetition is far lower than the cumulative gigawatt metric implies. Furthermore, larger stacks contain repeated cells, membranes, and electrode areas, meaning that even stack counts can mask underlying materials science improvements, such as higher current densities that yield more hydrogen without a proportional increase in raw materials.
3. The System Boundary Constraint
Perhaps the most glaring limitation of stack-centric cost projections is the fundamental breakdown of project capital expenditure (CAPEX). According to comprehensive global data from agencies like the International Energy Agency (IEA), the electrolyzer stack accounts for only 15% to 20% of a total installed hydrogen plant’s capital cost.
Typical Green Hydrogen Project CAPEX Breakdown:
[=======================------------------------]
  Stack (15-20%)        Balance of Plant (25-30%)
                        [-----------------------------------------------]
                        EPC, Engineering, Civil Works, Contingency (50%+)
As illustrated above:
- Balance of Plant (25%–30%): Sits in power electronics, piping, gas treatment, and compression.
- Engineering, Procurement, Construction (EPC) & Contingency (50%+): Accounts for more than half of the total financial outlay.
Even if a manufacturer achieves a miraculous 20% cost reduction in the stack itself, that component only represents one-fifth of the total budget. Consequently, a 20% drop in stack manufacturing costs shaves a mere 4% off the total installed project cost. The remaining 80% to 85% of the facility—including civil works, electrical grids, and complex construction labor—operates on entirely different productivity and scale trajectories.
Official Statements and Industry Insights
The realization that hydrogen economics diverge sharply from solar and battery paradigms has prompted candid assessments from industrial strategists, energy analysts, and engineering firms.

"Electrolyzer stacks are manufactured, but hydrogen plants are built. Much of the apparent learning challenge—and most of collar-to-collar project costs—lives outside the stack factory."
Industry experts emphasize that conflating manufacturing innovations with field construction realities has distorted capital allocation across the energy sector. Project developers are increasingly warning investors against taking historical learning rates, compounding them mechanically over decades, and assuming that global gigawatt targets will automatically translate into ultra-cheap commodity hydrogen.
Engineering contractors note that while modularization is helping to streamline construction, field installation, permitting, grid interconnection delays, and labor shortages in heavy industry do not experience technological learning curves in the same manner as semiconductor or automated manufacturing lines. First-of-a-kind (FOAK) execution risks are routinely underestimated, and transitioning to Nth-of-a-kind (NOAK) economics requires systematic supply chain maturation across civil, electrical, and chemical disciplines—not just gigawatt-scale stack factories.
Future Outlook: A Pragmatic Roadmap for Clean Hydrogen
None of the empirical corrections outlined above imply that green hydrogen is doomed to remain perpetually expensive, nor that electrolyzer projects will permanently mirror today’s high-cost installations. Significant, permanent cost reductions are entirely achievable, but they will be driven by a diverse portfolio of discrete mechanisms rather than a single magic-bullet experience curve.
Decoupling Variables in Future Forecasting
To build resilient economic models, forecasters and project developers must separate and independently model the following variables:
- Electrochemical Performance & Materials: Improvements in catalyst loading, membrane durability, and current density.
- Stack Manufacturing: Automation and scaling of stack factories.
- Chemical Plant Optimization: Reaching optimal sizes for balance-of-plant equipment, shared purification systems, and standardized process trains.
- Construction and Engineering: Maturation of EPC contracting, modular design, and the elimination of bespoke engineering overhead.
- External Variable Costs: Grid electricity pricing, plant utilization rates, financing costs, and logistics infrastructure.
The Electricity and Infrastructure Reality
Even if equipment capital costs fall significantly, CAPEX is only part of the final hydrogen price equation. Electricity dominates the variable cost of production, and manufacturing learning curves cannot eliminate the fundamental cost of electrons.
To achieve high capacity factors and optimize capital-intensive electrolyzers, plants often require steady power supplies. However, the cheapest wind and solar electricity is inherently intermittent. Balancing high equipment utilization with variable, low-cost renewable power introduces complex operational trade-offs. Furthermore, downstream compression, pipeline storage, cryogenic liquefaction, and distribution logistics carry their own infrastructure economics that are entirely decoupled from stack manufacturing efficiencies.
Conclusion: Planning for Reality
Hydrogen will undoubtedly become cheaper than what early, first-generation demonstration projects have demonstrated. However, the modern empirical evidence delivers a clear mandate: the industry must abandon the illusion of a steep, persistent cost curve driven purely by global gigawatt accumulation.
Planners, policy makers, and investors must evaluate low-carbon hydrogen based on the true, unvarnished price complete systems can realistically achieve. By directing green hydrogen investments toward high-value applications where the molecule’s unique chemical properties justify its genuine cost of production—rather than forcing it into cheap-energy paradigms reserved for mass-manufactured electronics—the clean energy transition can build a durable, economically sound industrial foundation.