









Executive Overview
Global energy markets crossed a critical psychological and financial threshold on Wednesday as Brent crude futures breached the $100-a-barrel mark for the first time since late July. This surge was catalyzed by a dramatic escalation in the Middle East, where direct maritime hostilities between the United States and Iran reached their most destructive level since the outbreak of the regional conflict six months ago.
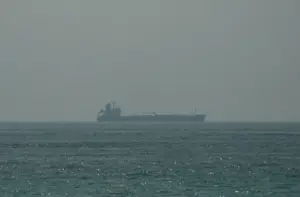
The immediate trigger for the price spike was a series of high-profile, kinetic strikes on commercial shipping and energy infrastructure. Iran launched attacks on ten vessels near the strategic Strait of Hormuz, while U.S. forces responded by sinking five Iranian oil tankers. This direct military confrontation shattered the fragile optimism that had kept energy benchmarks trading on a "low simmer" throughout the summer, forcing Wall Street and global energy traders to price in a prolonged disruption to Middle Eastern supply.
Energy Benchmarks & Market Impact (Wednesday Trading)
┌──────────────────────┬─────────────────┬──────────────┬────────────────────────┐
│ Benchmark            │ Current Price   │ Daily Change │ Session High           │
├──────────────────────┼─────────────────┼──────────────┼────────────────────────┤
│ Brent Crude Futures  │ $100.95 / bbl   │ +$3.04 (3.1%)│ $101.58 / bbl          │
│ WTI Crude (U.S.)     │ $95.78 / bbl    │ +$2.75 (3.0%)│ Highest since early June│
│ Dated Brent (Phys.)  │ >$100.00 / bbl  │ Consistent   │ Above $100 since Sep 3 │
│ European Diesel Fut. │ ~$200.00 / bbl  │ Record Highs │ Driven by refining gap │
└──────────────────────┴─────────────────┴──────────────┴────────────────────────┘
The financial fallout was immediate:

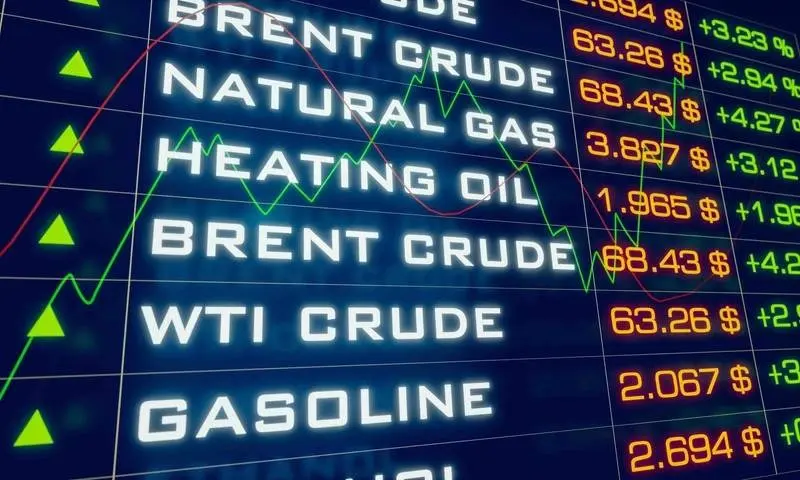
- Brent crude futures settled up $3.04, or 3.1%, at $100.95 a barrel, after touching an intraday high of $101.58.
- U.S. West Texas Intermediate (WTI) crude surged by $2.75, or 3%, to close at $95.78 a barrel—its highest level since early June.
- Refined products and physical crude benchmarks, which had already been trading at a premium due to a global refining bottleneck, surged even further.
With shipping volumes through the Strait of Hormuz collapsing to a fraction of their normal capacity and Iran-backed Houthi forces opening a secondary front against Saudi Arabian energy infrastructure, the global economy faces a renewed inflationary threat. The structural assumptions that defined the energy market over the last quarter have officially been upended.
Detailed Chronology
The current crisis is the culmination of a six-month conflict that began on February 28. To understand how the market arrived at $100-a-barrel oil, it is necessary to trace the shift from localized skirmishes to direct, state-on-state maritime warfare.
Timeline of Key Escalations (February 28 – Present)
─────────────────────────────────────────────────────────────────────────────────
Feb 28         Apr 30            Late May        Aug 30          Mid-Sept (Current)
  │              │                  │               │                   │
  ├──────────────┼──────────────────┼───────────────┼───────────────────┤
  │              │                  │               │                   │
War Begins     Brent Peaks at     Prices Drop     Fighting Resumes    Brent Breaches
               $126.41/bbl        Below $100      After Brief Truce   $100; Tankers
                                                                      Sunk in Gulf
─────────────────────────────────────────────────────────────────────────────────
Phase I: The Outbreak and Initial Price Shock (February 28 – April 30)
Following the outbreak of hostilities on February 28, energy markets reacted with panic. Brent crude surged to a peak of $126.41 a barrel on April 30 as financial markets priced in an immediate, catastrophic disruption to Persian Gulf exports. During this initial phase, shipping lines began rerouting vessels, insurance premiums for transit through the Gulf of Oman skyrocketed, and global logistics networks scrambled to find alternative pathways.
Phase II: The False Dawn and Temporary Truce (Late May – Late August)
By late May, the initial panic had subsided. Brent retreated below the $100-per-barrel mark, trading in a range that suggested the market believed the conflict would remain contained. This stabilization was largely driven by back-channel diplomacy between Washington and Tehran, which culminated in a temporary, unwritten agreement to cease direct attacks on commercial shipping. Although a permanent peace treaty remained elusive, the detente allowed oil flows to recover temporarily, prompting algorithmic traders and institutional investors to short volatility.
Phase III: The August Resumption and "Black Wednesday" Escalation
The diplomatic consensus collapsed on August 30 when localized skirmishes resumed. The situation reached a boiling point on Wednesday with the most aggressive maritime engagements of the war:
- The Iranian Offensive: Iranian forces targeted ten commercial vessels in the vicinity of the Strait of Hormuz, utilizing a combination of fast-attack craft, sea-skimming missiles, and loitering munitions.
- The U.S. Counterstrike: In a direct military response, U.S. naval assets engaged and sank five Iranian oil tankers that Washington alleged were being used to fund paramilitary operations and smuggle sanctioned crude.
- The Iraqi Drone Strike: In Iraqi territorial waters, a tanker carrying approximately 2 million barrels of Iraqi fuel oil was struck and heavily damaged by an explosive drone.
- The Gulf of Oman Casualties: The United Kingdom Maritime Trade Operations (UKMTO) reported that multiple merchant vessels had been hit by disabling fire overnight. Off the coast of Dubai, a seafarer was killed aboard the Gibraltar-flagged oil products tanker Hercules Star while the vessel was at anchorage.
Supporting Context & Metrics
The disruption to physical oil flows has exposed the vulnerability of global energy supply chains. The primary focal point of this vulnerability is the Strait of Hormuz, a narrow waterway through which approximately 20% of the world’s liquefied natural gas (LNG) and petroleum liquids flow.
Strait of Hormuz Daily Transit Volume (bpd)
  9M ├───────────────┐ (Pre-August 30)
  8M │               │
  7M │               │
  6M │               │
  5M │               │
  4M │               │
  3M │               │
  2M │               ├───────────────┐ (Current Post-Escalation)
  1M │               │               │
  0M └───────────────┴───────────────┘
The Collapse of Hormuz Transit
According to preliminary shipping data compiled by Kpler, only six commodity vessels transited the Strait of Hormuz on Tuesday. This is a decline from nine vessels the previous day, and sits well below the 10-day historical average of 12 transits.
The volume of crude flowing through this artery has fallen sharply:
- Pre-August 30 Flow: Approximately 8 million to 9 million barrels per day (bpd).
- Current Flow: Under 2 million bpd.
This massive supply deficit has left physical refiners scrambling to secure alternative cargoes from West Africa, the North Sea, and the Americas, driving up spot prices across the globe.
The Disconnect Between Paper and Physical Markets
While futures contracts have only now breached the $100 mark, the physical crude market has been operating under conditions of extreme scarcity for weeks. Dated Brent—the benchmark used to price roughly two-thirds of the world’s physical cargoes—has traded consistently above $100 per barrel since September 3.
Physical vs. Paper Crude Pricing Dynamics
┌──────────────────────────────┬──────────────────────────────┐
│ Physical Crude (Dated Brent) │ Futures Contracts (Paper)    │
├──────────────────────────────┼──────────────────────────────┤
│ • Priced above $100 since    │ • Breached $100 on Wednesday │
│   September 3.               │ • Driven by speculative flow │
│ • Reacts instantly to spot   │   and hedging strategies.    │
│   shortages and cargo delays.│ • Delayed reaction due to    │
│ • Driven by immediate        │   longer-term expectations   │
│   refinery demand.           │   of diplomatic resolution.  │
└──────────────────────────────┴──────────────────────────────┘
This divergence exists because physical markets reflect immediate supply-and-demand realities. Refiners who need to keep plants running cannot wait for next month’s futures contract; they must buy available spot cargoes immediately, paying whatever premium is demanded to secure delivery.
The Downstream Crisis: Refined Products and Consumer Pain
For retail consumers, the "$100-a-barrel" threshold was crossed long ago in the form of refined fuels. A global refining capacity crunch, exacerbated by wartime disruptions, has pushed gasoline and diesel prices to historic highs relative to crude oil.
- United States: Retail gasoline averages $4.22 a gallon nationwide, while diesel prices are closing in on a record $6.00 a gallon.
- Europe: The situation is even more acute. European diesel futures are trading near the equivalent of $200 a barrel, driven by a combination of restricted imports through the Suez Canal, Houthi threats in the Red Sea, and structural deficits resulting from the cutoff of Russian product supplies. Refining margins—the profit refiners make per barrel of crude processed—have reached unprecedented levels.
Official Statements & Geopolitical Analysis
The rapid escalation of hostilities has drawn sharp commentary from energy analysts, security experts, and market strategists, all of whom warn that the structural dynamics of the oil market have fundamentally changed.
Ole Hansen, Head of Commodity Strategy at Saxo Bank:
"The move towards and back above $100 Brent is reflecting a market that increasingly has to change its view on how long the Middle East crisis will continue to curb supply from the region. For months, paper markets held a consensus view that diplomacy would eventually prevail. Today’s events have forced a painful repricing of that geopolitical risk premium."
Dennis Kissler, Senior Vice President of Energy Trading at BOK Financial:
"The near-term fundamentals have suddenly turned to much tighter supplies, and the back-and-forth strikes from the U.S. and Iran look to now be a mainstay, with any chance of a peace agreement moving further out in the distance. We are no longer looking at a temporary disruption; we are looking at a structural realignment of maritime risk."
Hamad Hussain, Senior Climate and Commodities Economist at Capital Economics:
"The key risk is whether the recent attacks on oil tankers lead to fewer ship-to-ship transfers taking place in the Gulf of Oman, which have so far played a key role in providing oil to global markets and keeping a lid on prices. If these safe-haven transfer zones are compromised, the physical market will tighten even further."
Daniela Hathorn, Senior Market Analyst at Capital.com:
"Houthi attacks on Saudi energy facilities have widened the threat further, raising concerns that disruption could spread beyond Iranian supply to the infrastructure and alternative routes that have helped keep Gulf crude flowing. By targeting Saudi infrastructure, regional proxy forces are systematically closing off the fallback routes that global markets rely on when the Strait of Hormuz is blocked."
Future Outlook
As the conflict enters its seventh month, the outlook for global energy markets remains highly volatile. Analysts see several key indicators that will determine whether Brent crude stabilizes around the $100 mark or spikes toward its previous high of $126.41.
Geopolitical Risk Scenarios and Price Projections
┌──────────────────────┬──────────────────────────────┬────────────────────────┐
│ Scenario             │ Core Triggers                │ Projected Brent Range  │
├──────────────────────┼──────────────────────────────┼────────────────────────┤
│ 1. Managed Conflict  │ • Occasional skirmishes      │ $95.00 – $105.00 / bbl │
│                      │ • Tanker escorts resume      │                        │
│                      │ • Strategic reserves released│                        │
├──────────────────────┼──────────────────────────────┼────────────────────────┤
│ 2. Escalation        │ • Full closure of Hormuz     │ $110.00 – $130.00 / bbl│
│                      │ • Multi-point infrastructure │                        │
│                      │   strikes in Saudi Arabia    │                        │
├──────────────────────┼──────────────────────────────┼────────────────────────┤
│ 3. Systemic Crisis   │ • Widespread shipping halt   │ $130.00+ / bbl         │
│                      │ • Direct hits on major Gulf  │                        │
│                      │   export terminals           │                        │
└──────────────────────┴──────────────────────────────┴────────────────────────┘
The Red Sea and Suez Canal Bottleneck
With the Strait of Hormuz increasingly hostile, shippers had hoped to rely on Saudi overland pipelines to Red Sea terminals as an alternative export route. However, this week’s Houthi drone and missile strikes on Saudi energy infrastructure have shown that these alternative pathways are also vulnerable.
If the Red Sea is rendered unsafe for international tankers, the remaining option for Persian Gulf crude destined for Europe and North America is the long voyage around the Cape of Good Hope. This detour adds 10 to 14 days to transit times, tying up global tanker capacity and raising shipping costs.
Macroeconomic Consequences
The return of triple-digit oil prices comes at a difficult time for global central banks. For the past year, the Federal Reserve and the European Central Bank have been raising interest rates to combat inflation. A sustained oil price shock threatens to undo this progress, driving up transport costs and feeding directly into consumer price indices.
If Brent crude remains above $100 a barrel through the fourth quarter, the likelihood of a stagflationary environment—characterized by sluggish economic growth and high inflation—will increase, particularly in energy-importing economies across Europe and developing Asia.
The Limits of Intervention
Unlike previous energy crises, Washington’s options for intervention are limited. The U.S. Strategic Petroleum Reserve (SPR) has already been drawn down to its lowest level in decades, reducing the government’s ability to cool the market through large-scale crude releases.
At the same time, OPEC+ producers have shown little interest in raising output to compensate for geopolitical shortfalls, leaving the market highly vulnerable to further supply shocks.
The direct military engagements of "Black Wednesday" have ended the era of cheap energy security. As commercial tankers burn in the Gulf and global shipping lines seek alternative routes, the energy market is adjusting to a new reality where geopolitical risk is no longer a temporary premium, but a core component of the price of oil.