








Executive Overview
Irish Continental Group plc (ICG), a leading maritime transport and logistics conglomerate operating across the Irish Sea and the English Channel, has released its interim financial results for the first half of 2026. The report presents a complex financial narrative characterized by strong top-line revenue expansion alongside noticeable margin compression.
For the six-month period ending June 30, 2026, ICG generated group revenues of €359.9 million, representing a robust 16.1% increase compared to the corresponding period in 2025. Consolidated earnings before interest, taxes, depreciation, and amortization (EBITDA) rose by 7.3% to reach €58.9 million. However, the top-line performance did not fully translate into bottom-line profitability. Operating profit dropped by 2.4% year-on-year to €24.0 million, exposing the severe cost pressures currently facing the European maritime and shipping sectors.
       ICG H1 2026 FINANCIAL SUMMARY
+----------------------------------------------------+
| Revenue: €359.9M           [▲ 16.1% YoY]           |
| EBITDA: €58.9M             [▲  7.3% YoY]           |
| Operating Profit: €24.0M   [▼  2.4% YoY]           |
+----------------------------------------------------+
The underlying factors squeezing ICG’s operating margins stem from structural cost increases across its operational footprint. Management cited significant cost inflation across four key operational areas:
- Fuel Costs: Volatile global energy markets maintained sustained upward pressure on maritime fuel expenses.
- Environmental Compliance: Escalating regulatory surcharges associated with European Union decarbonization mandates, including the EU Emissions Trading System (ETS) for maritime transport, impacted operating margins.
- Port Infrastructure Fees: Rising operational charges at major Irish, UK, and Continental port terminals increased overheads.
- Expanded Fleet Overhead: Fleet expansions—most notably the full-period operation of the RoRo passenger vessel James Joyce—introduced higher baseline operating costs.
While ICG’s Ferries Division managed to maintain modest profitability growth through expanding roll-on/roll-off (RoRo) freight capacity, passenger and tourist car volumes showed weakness throughout the first half of the year.
This trend worsened sharply during the critical peak summer trading window from July 1 through August 15. During this period, passenger car traffic fell by 7.9% and RoRo freight volumes dropped by 9.3% year-on-year.
This mid-summer pullback presents a strategic hurdle for the group, highlighting the difficulty of recovering elevated operational and carbon-compliance costs through consumer-facing passenger fares during a period of macroeconomic uncertainty.
Detailed Chronology: Operational Timeline & Mid-Year Slowdown
               H1 2026 OPERATIONAL TIMELINE

   Jan - Jun 2026                   Jul 1 - Aug 15, 2026
+--------------------------------+ +--------------------------------+
| • James Joyce in full service  | | • Car Volumes:    ▼ 7.9% YoY   |
| • RoRo Freight: ▲ 4.1%         | | • RoRo Freight:   ▼ 9.3% YoY   |
| • Revenue:      ▲ 16.1%        | | • Summer trading slowdown    |
| • Op Profit:    ▼ 2.4%         | | • Cost recovery challenges   |
+--------------------------------+ +--------------------------------+
Phase I: H1 Expansion and Vessel Integration (January – June 2026)
During the first six months of 2026, ICG focused on capacity deployment and route consolidation. The primary driver of the group’s freight growth was the integration of the vessel James Joyce, which operated for the entire reporting period. This continuous deployment provided extra berth capacity and schedule reliability across the group’s key maritime corridors.
In the first half of the year, RoRo freight traffic grew steadily, buoyed by stable industrial supply chains between Ireland, the United Kingdom, and Western Europe. By June 30, ICG had transported 409,500 RoRo freight units, marking a 4.1% increase over H1 2025.
However, consumer-driven market segments experienced headwinds early on:
- Passenger Car Volumes: Declined by 5.7% to 249,700 units.
- Total Passenger Count: Dropped by 1.6% to 1.26 million travelers.
Despite these lower passenger numbers, high freight utility helped push total group revenue up by 16.1% to €359.9 million.
Phase II: Financial Mid-Year Assessment (June 30, 2026)
As of June 30, ICG’s financial statements highlighted the operational squeeze affecting modern short-sea shipping operators:
| Financial Metric | H1 2026 | YoY Growth / Change |
|---|---|---|
| Group Revenue | €359.9 million | +16.1% |
| Group EBITDA | €58.9 million | +7.3% |
| Operating Profit | €24.0 million | -2.4% |
| Ferries Revenue | €237.9 million | +15.5% |
| Ferries EBITDA | €41.9 million | +4.8% |
| Ferries Operating Profit | €14.8 million | +5.0% |
While top-line growth remained strong, operating profit contracted by 2.4%. This reflected an imbalance where revenue gains were outpaced by operational expenses, including bunker fuel, emissions allowances, labor, and port service charges.
Phase III: The Peak Summer Slowdown (July 1 – August 15, 2026)
The third quarter started with a notable downturn during what is traditionally the company’s most profitable operational period. Between July 1 and August 15, key metrics fell sharply across all major sectors:
           PEAK SUMMER PERFORMANCE SLUMP
            (July 1 – August 15, 2026 YoY)

  Car Volumes         [▼ 7.9%]  ------------------->
  RoRo Freight        [▼ 9.3%]  --------------------->

  Impact: Revenue pressure during key profit window
This slowdown during the peak summer weeks presented an operational challenge. High fixed costs—driven by expanded fleet operations and elevated fuel expenditure—could not be offset by volume growth or fare increases. As consumer discretionary spending weakened and industrial freight movements slowed, ICG faced a difficult trading environment going into the second half of the year.
Supporting Context & Operational Metrics Deep Dive
To understand ICG’s H1 2026 financial performance, it is helpful to look closely at its key business units, macro-environmental factors, and cost structures.
                  ICG H1 2026 REVENUE BREAKDOWN

   +-------------------------------------------------------+
   | Ferries Division: €237.9M (66.1%)                      |
   +-------------------------------------------------------+
   | Container & Terminal Division (Implied): €122.0M (33.9%)|
   +-------------------------------------------------------+
1. Ferries Division vs. Container & Terminal Division
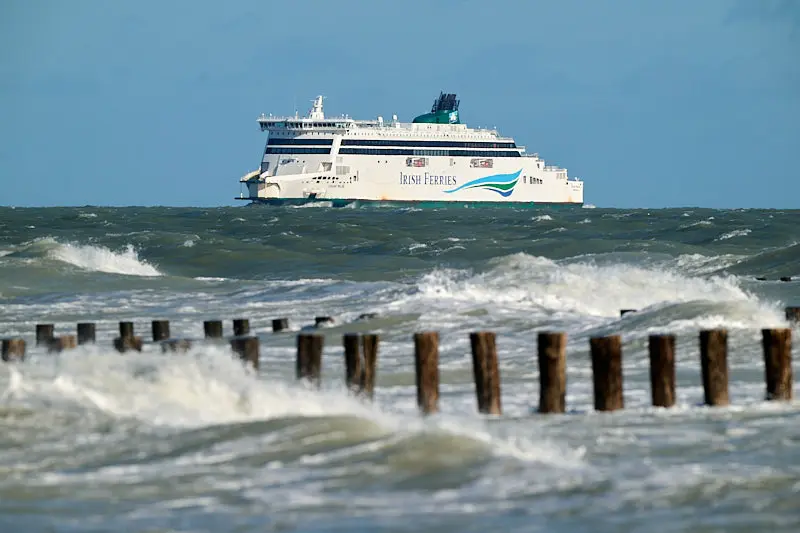
The Ferries Division remains ICG’s primary revenue driver, benefiting directly from passenger services and integrated RoRo freight routes under the Irish Ferries brand.
- Ferries Division Performance:
- Revenue: €237.9 million (+15.5% YoY)
- EBITDA: €41.9 million (+4.8% YoY)
- Operating Profit: €14.8 million (+5.0% YoY)
The growth in the Ferries Division was aided by higher capacity deployment and route adjustments across both the Irish Sea and Dover-Calais crossings. However, the division’s EBITDA growth (+4.8%) lagged behind its revenue growth (+15.5%), pointing to rising per-mile operational costs.
- Container & Terminal Division Performance (Implied):
- Revenue: Approximately €122.0 million (up from €109.8 million in H1 2025)
- EBITDA: Approximately €17.0 million (up from €14.8 million in H1 2025)
- Operating Profit: Approximately €9.2 million (down from €10.5 million in H1 2025)
The group’s container feeder and port terminal handling facilities (including Eucon and terminal operations in Dublin and Belfast) faced lower margins. Rising terminal labor costs, port infrastructure fees, and fluctuating container yields impacted profitability across the unit.
2. Operational Volume Analysis
              H1 2026 OPERATIONAL VOLUMES

  RoRo Freight   [409,500 units]   ▲ 4.1% YoY
  Car Traffic    [249,700 units]   ▼ 5.7% YoY
Passengers [1.26 million] ▼ 1.6% YoY- RoRo Freight (409,500 Units | +4.1%): The addition of the James Joyce increased vessel scheduling flexibility, allowing ICG to capture higher freight traffic during Q1 and Q2.
- Car Volumes (249,700 Units | -5.7%): Car traffic fell, reflecting broader pressure on household travel budgets and reduced tourism travel across the UK, Ireland, and France.
- Passenger Volumes (1.26 Million | -1.6%): Overall passenger traffic showed minor contraction, with foot-passenger traffic holding up better than tourist car traffic.
3. Key Cost Pressures and Regulatory Drivers
               KEY COST INFLATION DRIVERS

  +------------------+------------------------------------+
  | Fuel Costs       | Global bunker market volatility    |
  +------------------+------------------------------------+
  | Environmental    | EU ETS compliance costs & levies   |
  +------------------+------------------------------------+
  | Port Operations  | Tariff increases by port authorities|
  +------------------+------------------------------------+
  | Fleet Expansion  | Higher operational overheads       |
  +------------------+------------------------------------+
The underlying squeeze on ICG’s profitability stems from a combination of rising operational and regulatory costs:
- Bunker Fuel Costs: Global energy market volatility maintained high baseline fuel costs throughout the period. Fuel surcharges applied to commercial freight contracts only partially offset these expenses.
- Environmental Surcharges (EU ETS & FuelEU Maritime): The phasing-in of the European Union Emissions Trading System (ETS) for shipping operators mandated the purchase of carbon allowances for emissions on voyages within, into, and out of EU ports. Meeting these regulatory requirements added direct compliance expenses to every sailing.
- Port and Infrastructure Tariffs: Port authorities increased berthage, quay, and passenger facility fees to cover their own energy, infrastructure, and labor cost increases.
- Asset Expansion Overhead: Operating extra tonnage like the James Joyce incurs fixed overheads—including crew payroll, technical maintenance, insurance, and dry-dock provisioning—which require high volume usage to remain profitable.
Official Statements & Strategic Squeeze
In its half-year market update, Irish Continental Group leadership outlined the clear contrast between top-line expansion and operating cost inflation.
Management specifically pointed to late-summer trading conditions, calling the sharp drop in traffic during July and August a significant operational hurdle:
"Trading weakened further during the peak summer period… ICG described this development as a significant challenge, particularly given the continued high fuel prices and difficulty of recovering these costs through passenger fares."
             THE COST-PASS-THROUGH DILEMMA

     Rising Input Costs            Consumer Elasticity
   (Fuel, ETS, Port Fees)        (Weak Summer Demand)
             │                              │
             ▼                              ▼
    +------------------------------------------------+
    | Inability to fully pass costs onto consumers   |
    | without further dampening ticket demand.       |
    +------------------------------------------------+
             │
             ▼
    [ Margin Compression & Operating Profit Reduction ]
This statement highlights a core dilemma for short-sea ferry operators:
- Commercial Freight Elasticity: Commercial freight accounts feature established Fuel Adjustment Factors (FAF) and carbon surcharge mechanisms that allow shipping companies to pass variable fuel and regulatory costs on to logistics clients, albeit with a short delay.
- Passenger Fare Sensitivity: Tourist and leisure car travel is sensitive to price changes. With household budgets under pressure across Europe, raising ticket prices to cover operational and carbon costs runs the risk of lowering demand further.
As a result, management chose not to aggressively raise passenger fares during the summer peak. While this strategy helped protect base passenger volumes from steeper drops, it required the group to absorb higher operating expenses, leading to margin compression.
Future Outlook & Strategic Options
As Irish Continental Group navigates the second half of 2026, its management team faces a challenging operational environment requiring careful balance between capacity, cost controls, and yield management.
               ICG STRATEGIC OUTLOOK & OPTIONS

  +---------------------+-----------------------------------+
  | Capacity Management | Rationalizing low-margin sailings |
  +---------------------+-----------------------------------+
  | Cost Pass-Through   | Refining surcharge mechanisms     |
  +---------------------+-----------------------------------+
  | Fleet Efficiency    | Investments in hull & fuel tech   |
  +---------------------+-----------------------------------+
  | Market Positioning  | Balancing Irish Sea & Dover routes|
  +---------------------+-----------------------------------+
1. Capacity Rationalization and Fleet Adjustments
Following the volume contraction seen between July and mid-August, ICG may look to adjust its winter schedule. This could involve realigning vessel deployments across the Irish Sea and Dover-Calais corridors, reducing sailing frequencies on lower-yield schedules, or reassigning vessels to maximize freight usage over low-season passenger routes.
2. Evolving Cost-Recovery Surcharge Models
To offset environmental compliance costs, ICG will likely refine its surcharge models heading into 2027. As the EU ETS carbon allowance requirements scale up toward 100% coverage, shipping lines will need to establish clear, standardized environmental surcharges across both commercial freight and passenger sectors.
3. Decarbonization and Fleet Efficiency Investments
Given the growing cost of carbon compliance, capital investment in fuel-efficient operations is increasingly critical. ICG may focus capital expenditure on hull performance coatings, alternative fuel readiness, engine efficiency modifications, and onshore power capabilities (cold ironing) at key ports. These measures can help reduce bunker consumption and lower carbon allowance liabilities over time.
4. Macroeconomic and Trade Corridor Dynamics
ICG’s strategic outlook remains tied to macro trade flows between Ireland, the UK, and Continental Europe. The post-Brexit trade environment has stabilized into two primary logistics channels:
- Direct maritime routes linking Ireland directly to France, bypassing UK land transit.
- Traditional short-sea routes across the Irish Sea combined with high-frequency Dover-Calais crossings.
By maintaining operational flexibility across both models, ICG remains well-positioned to adapt to changing trade patterns. However, managing high fixed operating costs alongside shifting consumer demand will remain critical to protecting long-term earnings.
Conclusion
Irish Continental Group’s H1 2026 financial results reflect broader trends within the North European maritime transport market. While revenue growth of 16.1% to €359.9 million demonstrates strong baseline demand for the company’s freight and transport network, a 2.4% drop in operating profit highlights the realities of input cost inflation.
With energy prices remaining high, environmental compliance costs increasing, and summer consumer demand slowing, ICG faces an operational landscape that demands strict cost management and prudent yield control. How successfully the company balances fleet expansion with cost recovery in the coming quarters will determine whether it can convert top-line growth back into sustainable bottom-line profitability.