





Executive Overview
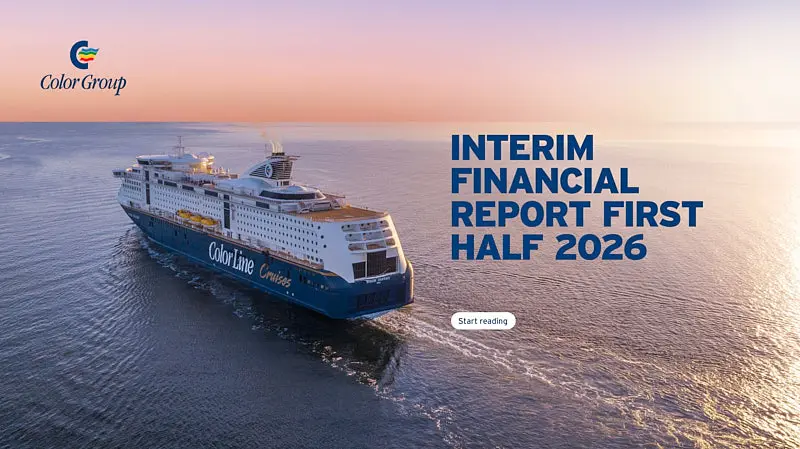
Norwegian maritime and ferry operator Color Group has reported a dual-tracked financial performance for the first half of 2026. While top-line operating revenue expanded on the back of resilient freight demand and elevated onboard consumer spending, profitability faced severe headwinds. A sharp rise in energy expenses and the full implementation of European environmental regulations eroded operating margins, leading to a widening net loss for the period.
+-------------------------------------------------------------------------+
|                      COLOR GROUP H1 2026 AT A GLANCE                    |
+--------------------------+-------------------+------------------+-------+
| Metric                   | H1 2025           | H1 2026          | YoY % |
+--------------------------+-------------------+------------------+-------+
| Operating Revenue        | NOK 2.89 Billion  | NOK 2.96 Billion | +2.6% |
| EBITDA                   | NOK 255 Million   | NOK 153 Million  | -40.0%|
| EU ETS Compliance Costs  | NOK 83 Million    | NOK 140 Million  | +68.7%|
| Net Loss                 | NOK 229 Million   | NOK 277 Million  | +21.0%|
| Passenger Volume         | 1.56 Million*     | 1.52 Million     | -2.4% |
| Freight Volume (12m equiv)| 76,037 Units*    | 78,166 Units     | +2.8% |
+--------------------------+-------------------+------------------+-------+
(*Derived from YoY percentage changes)
During H1 2026, Color Group’s consolidated operating revenue reached NOK 2.96 billion, representing a 2.6% increase compared to the NOK 2.89 billion recorded in the first half of 2025. This top-line growth was primarily driven by strategic yield management across passenger and freight segments, alongside enhanced onboard retail and dining sales.
However, earnings before interest, taxes, depreciation, and amortization (EBITDA) fell sharply from NOK 255 million in H1 2025 to NOK 153 million in H1 2026—a decline of 40%. The primary driver of this compression was a surge in regulatory and environmental compliance expenditures, most notably expenses tied to the European Union Emissions Trading System (EU ETS). As compliance obligations scaled from 70% of emissions in 2025 to 100% in 2026, Color Group’s ETS costs jumped from NOK 83 million to NOK 140 million.
Consequently, the group’s net loss for the first six months of 2026 expanded to NOK 277 million, compared to a net loss of NOK 229 million during the corresponding period in 2025.
Detailed Chronology & Financial Breakdown
    H1 2025                             H1 2026
+-------------------+               +-------------------+
| Revenue: NOK 2.89B|               | Revenue: NOK 2.96B| (Up +2.6%)
| EBITDA:  NOK 255M |               | EBITDA:  NOK 153M | (Down -40.0%)
| EU ETS:  NOK 83M  | (70% Phase-In)| EU ETS:  NOK 140M | (100% Phase-In)
| Net Loss:NOK 229M |               | Net Loss:NOK 277M | (Expanded +21.0%)
+-------------------+               +-------------------+
Revenue Realization vs. Margin Compression
The first half of the financial year for Northern European passenger ferry operators is structurally affected by seasonal travel patterns. Q1 and Q2 are traditionally characterized by lower leisure passenger volumes compared to the peak third quarter, making freight revenue and baseline operational efficiency critical to performance.
For H1 2026, Color Group demonstrated commercial capability by expanding its top line to NOK 2.96 billion. The group capitalized on dynamic pricing strategies and improved yield per passenger to offset a minor softening in overall passenger volumes. Increased onboard spend per ticket was a key contributor, sustained by curated passenger services, specialized retail offerings, and tax-free shopping incentives across its short-sea routes connecting Norway, Sweden, Denmark, and Germany.
Despite these operational gains, variable costs expanded faster than top-line revenues. Operating expenditures were squeezed by elevated marine energy costs and persistent inflationary pressures across supply chains, port fees, and labor contracts.
The Weight of Regulatory Compliance: EU ETS Impact
The most significant operational cost increase stemmed from maritime carbon compliance mandates.
EU ETS Maritime Phase-In Schedule & Color Group Compliance Cost Impact:
--------------------------------------------------------------------
2024: 40% Coverage Phase-In  ---> Initial cost exposure
2025: 70% Coverage Phase-In  ---> NOK 83 Million
2026: 100% Coverage Phase-In ---> NOK 140 Million (+68.7% YoY)
The European Union’s decision to incorporate the maritime sector into the EU ETS requires shipping lines operating within EU/EEA ports to purchase and surrender European Union Allowances (EUAs) for their carbon dioxide emissions.
Under the regulation’s transitional framework:
- 2024: Shipowners were required to surrender allowances for 40% of reported emissions.
- 2025: Compliance obligations expanded to 70% of reported emissions, costing Color Group NOK 83 million in H1 2025.
- 2026: The requirement reached 100% coverage, driving Color Group’s ETS compliance costs up by NOK 57 million year-over-year to NOK 140 million in H1 2026.
This 68.7% increase in carbon-related charges represented more than half of the total decline in group EBITDA, illustrating how environmental policy direct impacts operating cash flows in short-sea shipping.
Supporting Context & Operational Metrics
Passenger Segment Dynamics: Yield Optimization amid Volume Softening
During the first half of 2026, Color Line carried 1.52 million passengers, representing a 2.4% contraction compared to the same period in 2025.
Passenger Volume (H1 2025 vs H1 2026)
--------------------------------------
H1 2025: [|||||||||||||||||||||||||||||||||||||||||||||||||] ~1.56M
H1 2026: [||||||||||||||||||||||||||||||||||||||||||||||||]  1.52M (-2.4%)
The reduction in passenger volumes reflects broader macroeconomic conditions in Scandinavia and Northern Europe, where consumer purchasing power remains constrained by elevated interest rates and living costs.
However, Color Group mitigated the impact of lower passenger counts through yield optimization:
- Higher Revenue per Passenger: Average spend per passenger rose across core lines (such as Oslo–Kiel and Sandefjord–Strömstad), driven by targeted pricing and premium cabin packages.
- Onboard Spend Improvements: Upgrades to duty-free retail experiences, food and beverage concepts, and onboard entertainment supported higher spending per customer.
Freight Segment Resilience: Volume Growth and Yield Improvements
In contrast to the passenger segment, Color Group’s cargo and freight division delivered solid growth. Total freight volumes increased by 2.8% year-over-year, rising to 78,166 units (measured in 12-metre equivalents).
Freight Volume in 12-metre Equivalents (H1 2025 vs H1 2026)
------------------------------------------------------------
H1 2025: [=================================================  ] ~76,037 units
H1 2026: [================================================== ]  78,166 units (+2.8%)
This growth underscores the importance of Color Group’s Ro-Ro (Roll-on/Roll-off) capacity within Northern Europe’s supply chain network. Key operational factors included:
- Enhanced Freight Yields: Improved freight rates helped offset higher operational overhead and carbon costs.
- Supply Chain Route Stability: Importers and logistics providers prioritized Color Line’s direct corridors between Norway and continental Europe to minimize transit times and highway congestion.
Official Statements & Industry Perspectives
Executive Insights on Cost Drivers
Commenting on the interim results, Color Group management highlighted the disparity between core operational performance and external cost pressures. While commercial strategy produced top-line gains, external regulatory charges disrupted earnings growth.
"The first half of 2026 demonstrated the strength of our underlying operational model and commercial offering. We achieved higher revenue per passenger and recorded solid growth in our freight operations despite challenging macroeconomic conditions across our core markets.
"However, our financial earnings were significantly impacted by non-operational structural costs, notably the full implementation of the EU Emissions Trading System. With compliance requirements scaling to 100% this year, environmental charges increased substantially, weighing heavily on our operational EBITDA and net results."
— Color Group Management Statement
Industry Context & Regulatory Challenges
The challenges faced by Color Group mirror trends across the broader European maritime sector. Shipowners operating within the European Economic Area are navigating a complex landscape defined by stricter decarbonization mandates, such as the EU ETS and FuelEU Maritime regulations.
Industry analysts point out that while short-sea shipping remains a fuel-efficient mode of transport per tonne-kilometer, the financial burden of carbon compliance can put pressure on operating margins if costs cannot be fully passed on to end customers.
Furthermore, transitional challenges persist as green replacement fuels (such as e-methanol, green ammonia, and bio-LNG) remain limited in availability and command price premiums compared to conventional marine fuels.
Strategic Future Outlook & Industry Context
Second-Half Projections and Full-Year Expectations
Color Group enters the second half of 2026 with a degree of operational momentum supported by peak summer travel. The month of July delivered strong commercial performance across both passenger bookings and onboard yields, providing cash flow support heading into the third quarter.
2026 Financial Trajectory & Expectations:
+-------------------+---------------------------------------------------------+
| Period            | Operational & Financial Expectation                     |
+-------------------+---------------------------------------------------------+
| H1 2026           | Net Loss of NOK 277M (Impaired by NOK 140M ETS costs)  |
| July 2026         | Strong seasonal performance (Peak volume and revenue)   |
| H2 2026           | Expected to perform broadly in line with H2 2025        |
| Full-Year 2026    | Overall result expected to be somewhat weaker than 2025 |
+-------------------+---------------------------------------------------------+- H2 2026 Outlook: The group expects performance in the second half of 2026 to be broadly in line with H2 2025.
- Full-Year 2025 Comparative: Because of the larger net loss recorded in H1, Color Group anticipates that its full-year 2026 net result will be somewhat weaker than in 2025.
Long-Term Sustainability and Structural Adaptation
To protect profitability against rising carbon expenditures, Color Group is advancing operational and technological initiatives aimed at lowering its overall emissions baseline:
                  +-----------------------------------+
                  |   DECARBONIZATION STRATEGY        |
                  +-----------------------------------+
                                    |
        +---------------------------+---------------------------+
        |                                                       |
        v                                                       v
+-------------------------------+               +-------------------------------+
|     FLEET EFFICIENCY          |               |    ALTERNATIVE ENERGY         |
|  - Shore power connections    |               |  - Battery hybrid propulsion  |
|  - Hull & route optimization  |               |  - Alternative low-carbon     |
|  - Fuel-saving tech upgrades  |               |    marine fuels               |
+-------------------------------+ +-------------------------------+- Fleet Modernization and Electrification: Expanding shore-power capabilities at key ports (including Oslo, Larvik, Sandefjord, and Kiel) enables vessels to shut down auxiliary diesel generators while docked, cutting port emissions and reducing required ETS allowances.
- Alternative Fuel Transition: Color Group continues to evaluate low-carbon marine fuels and hybrid propulsion technology—building on experience with vessels such as the plug-in hybrid Color Hybrid—to reduce lifecycle emissions.
- Surplus Pass-Through Mechanics: The company is refining its carbon surcharge structures (ETS surcharges) for freight forwarders and travel customers to ensure environmental regulatory costs are distributed along the supply chain.
Conclusion
Color Group’s H1 2026 performance illustrates the current environment for European maritime operators: strong top-line revenues driven by commercial execution are being offset by the rising costs of regulatory compliance and environmental transition.
As the group enters the second half of the year, maintaining operational efficiency, managing carbon surcharges, and executing on long-term sustainability goals will remain key to navigating margin pressures and ensuring financial stability.