For the millions of fans who descended upon host cities across the United States, Canada, and Mexico, getting to a FIFA World Cup match felt deceptively simple. The blueprint was familiar: board a local train, follow brightly colored wayfinding signage, catch a connecting shuttle to the stadium gates, celebrate the victory or mourn the defeat, and retrace your steps home. To the uninitiated, the transportation apparatus appeared effortless—a seamless, self-propelling machine of mass mobility.
Yet, what the traveling public rarely saw was the monumental, behind-the-scenes logistical ballet that made it all possible. Unlike a one-day spectacle like the Super Bowl or a localized championship parade, the World Cup was a relentless, multi-week endurance test. It was an unprecedented convergence of public transit agencies, regional planners, private motorcoach operators, federal bodies, law enforcement agencies, and tens of thousands of frontline employees working in continuous coordination.
Operating across vast geographical expanses and uniquely fractured municipal transit networks, these entities spent months developing contingency routes, training drivers, staging fleets, and engineering real-time solutions. They had to sustain extraordinary service levels over weeks of continuous matches, all while maintaining everyday mobility for local residents. Ultimately, the tournament served as a massive mobility laboratory, testing the limits of North American transportation infrastructure and forging an integrated blueprint for future mega-events, such as the upcoming 2028 Olympic and Paralympic Games.
Detailed Chronology: The Multi-Week Endurance Test
The logistical hurdle of the World Cup lay primarily in its relentless repetition. While major domestic championships demand intense operational focus for a single weekend, the tournament required host cities to reset, maintain vehicles, adjust staffing, and scale up operations every few days over a grueling multi-week schedule.
The Opening Phase: Establishing the Baseline
In the initial days of the tournament, transportation networks immediately encountered high-volume stress tests. Unlike routine weekday commutes, where passenger flows peak predictably during morning and evening rush hours, World Cup match days introduced erratic, hyper-concentrated surges. Thousands of international visitors unfamiliar with local transit systems flooded platform gates simultaneously hours before kickoff, then attempted to exit en masse immediately following the final whistle.
Transit agencies quickly learned that static schedules were liabilities. Operators had to deploy dynamic management systems, monitoring real-time platform crowding via closed-circuit cameras and IoT sensors to trigger ad-hoc express trains and reserve bus bridges on a moment’s notice.
Mid-Tournament Peaks and Operational Adaptation
As the group stages progressed into high-stakes elimination rounds, system volumes shattered historical records across multiple markets. For instance, in Atlanta, MARTA recorded a staggering 4.7 million rail passenger trips over a 35-day window that encompassed World Cup matches, fan festivals, concerts, and the traditional July 4 Peachtree Road Race.
The peak arrived on June 24, when a high-demand match between Morocco and Haiti pushed MARTA’s daily rail ridership to approximately 240,000 passenger trips—roughly 2.6 times a standard weekday volume. Across the tournament, match days regularly saw rail numbers soar to between two and three-and-a-half times normal operating levels.
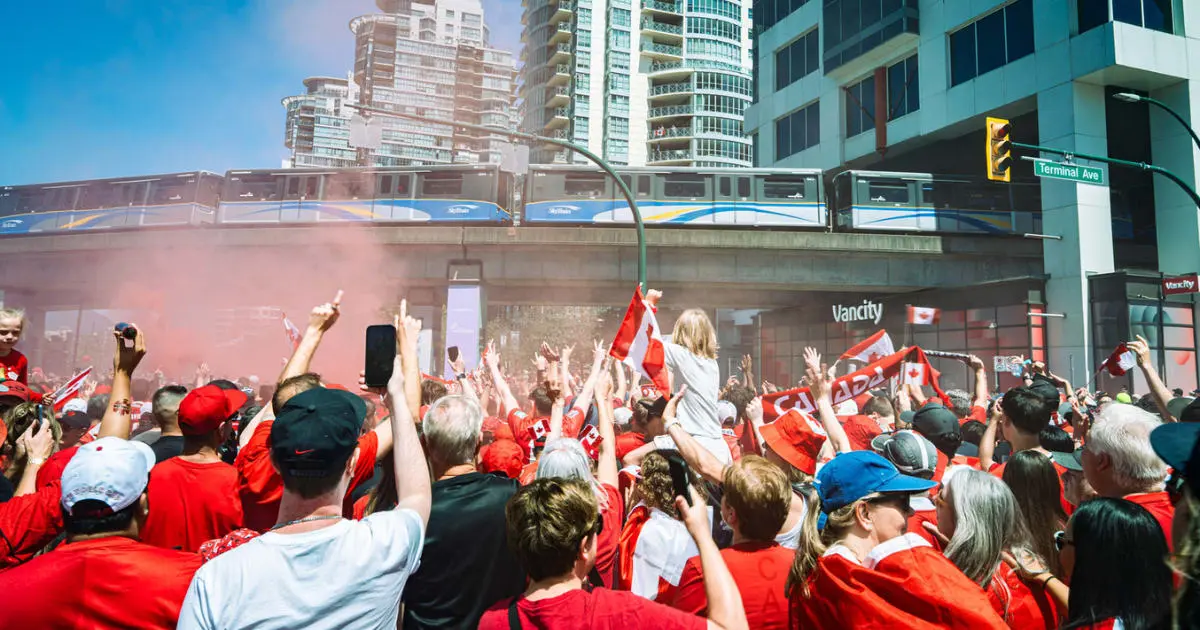
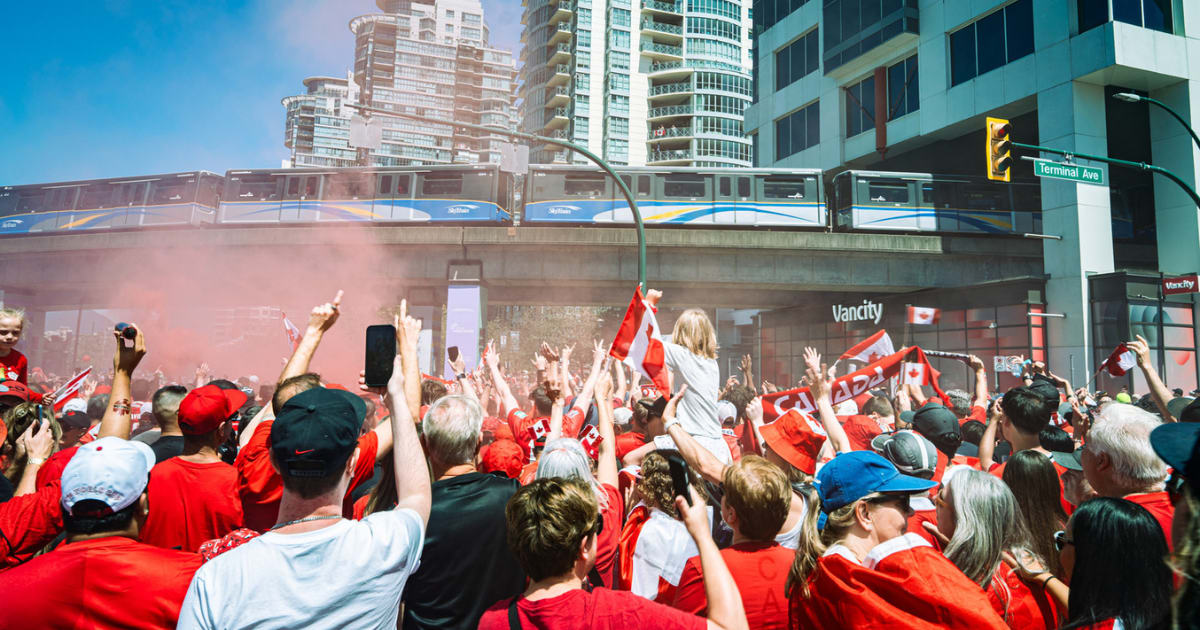
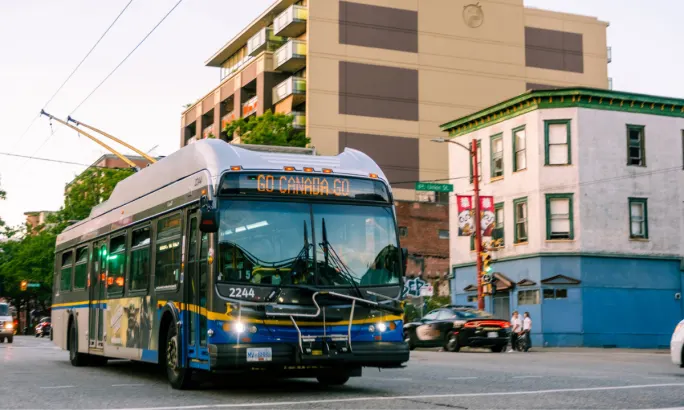
Similarly, in Vancouver, TransLink recorded an average of 87,000 additional boardings on each of the city’s seven match days, accumulating more than 600,000 supplementary transit boardings. June 24 proved to be a watershed moment for the Canadian city as well: when Canada faced Switzerland at BC Place, the system logged nearly 1.4 million boardings—its highest single-day ridership figure in over six years.
Managing the Fatigue Curve
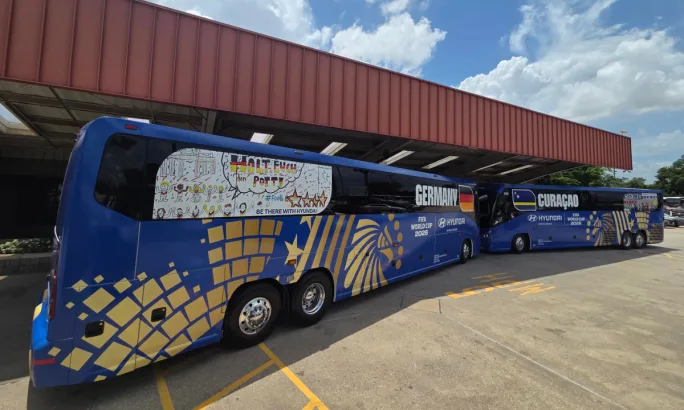
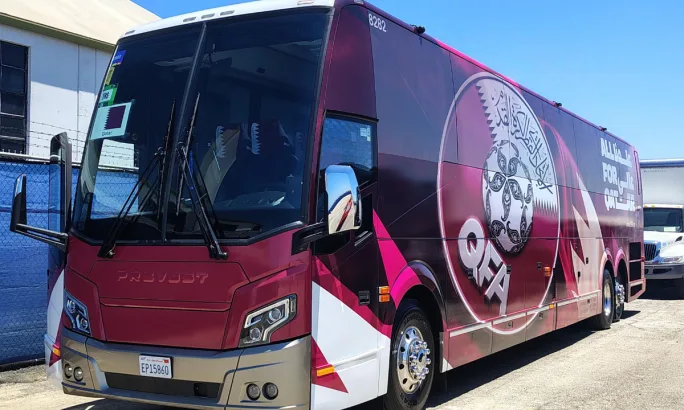
Behind the record-breaking passenger counts lay a grueling operational reality for maintenance yards and dispatch centers. Mechanics worked overnight shifts to perform accelerated preventive maintenance, repair wear-and-tear on rolling stock, and execute overnight vehicle-wrap changes as different national teams rotated through host markets. Drivers, administrative personnel, and transit ambassadors faced extended shifts, adapting to last-minute itinerary changes driven by fluctuating team schedules, VIP movements, and security protocols.
Supporting Context & Metrics: Quantifying the Mobility Surge
To truly grasp the scale of the 2026 World Cup transit operation, one must examine the hard metrics and infrastructural partnerships that bridged the gaps between fixed-route rail networks and stadium doorsteps.
The Power of the Public-Private Handshake
While fixed-rail transit formed the backbone of the urban transit strategy, buses and motorcoaches served as the essential connective tissue. North Texas provided a masterclass in intermodal coordination. For the nine matches hosted at the Arlington stadium, the Trinity Railway Express (TRE) carried thousands of fans to CentrePort Station. From that temporal hub, a fleet of 125 charter buses handled the final-leg transfer directly to the venue.
During the tournament, more than 40,000 fans utilized these charter connections, with roughly 30,000 arriving at CentrePort via the TRE. This fluid handoff between heavy rail and rubber-tire transit proved indispensable.
Regional Breakdowns and Performance Indicators
Atlanta (MARTA): Logged 4.7 million rail trips over 35 days, with peak days reaching 2.6x normal weekday loads. Customer support was heavily reinforced by 600 Transit Ambassadors completing 6,400 assignments, alongside 100 multilingual FIFA volunteers.
Vancouver (TransLink): Achieved its highest ridership day in six years on June 24 with 1.4 million boardings. Remarkably, despite the influx of international tourists, calls to TransLink’s Customer Information line actually dropped by 7.6% compared to the same month the previous year, demonstrating the exceptional effectiveness of on-the-ground wayfinding and digital updates.
Bay Area (VTA & Partners): The Santa Clara Valley Transportation Authority transported nearly 230,000 passengers to and from the stadium across six matches, easily eclipsing records set during previous Super Bowls and major concert events. The peak arrived on June 25, moving nearly 42,000 stadium-bound passengers.
South Florida (Tri-Rail): Recorded over 11,000 rides on Saturday, June 27, marking its highest Saturday ridership in history as fans traveled for the Portugal-Colombia clash in Miami. Tri-Rail successfully integrated express trains, post-game specials, and direct shuttles from Golden Glades Station.
Official Statements and Industry Insights
The ultimate objective of any elite transportation operation is paradoxically invisible: when everything goes according to plan, nobody notices the immense effort required to achieve it.
"One thing we often say is that the best transportation operation is the one nobody notices," noted Jared Flaum, director of sales and operations at Lux Bus America. "If teams arrived on time, schedules stayed on track, and transportation became something they never had to think about, then we had done our job."
Lux Bus America, working alongside Accord Pitch USA, managed the delicate task of providing dedicated, secure transportation for national teams, base camps, international media, broadcast personnel, and FIFA officials across Los Angeles, San Francisco, San Diego, and Arizona. Months of meticulous route planning, driver training, and contingency modeling allowed the company to preemptively solve crises before coaches ever left the yard.
The private sector also played a vital role in solving localized infrastructural bottlenecks. First Class Transportation managed team base camps in Austin and Houston, alongside high-capacity game-day operations for The Woodlands Transit, which operated at 100% capacity throughout the event. Frede Smith, director of business development for First Class, emphasized the unique nature of the operational cadence:
"We have supported other major events, including Super Bowls, but the World Cup was different in its duration and repetition. Operationally, it was almost like having multiple Super Bowls every few days."
Smith also highlighted the human element that underpinned the success of the motorcoach fleets:
"Our drivers were the backbone of the entire operation. They had to be flexible as schedules and operational needs changed, while maintaining the safety and professionalism expected during an event of this magnitude."
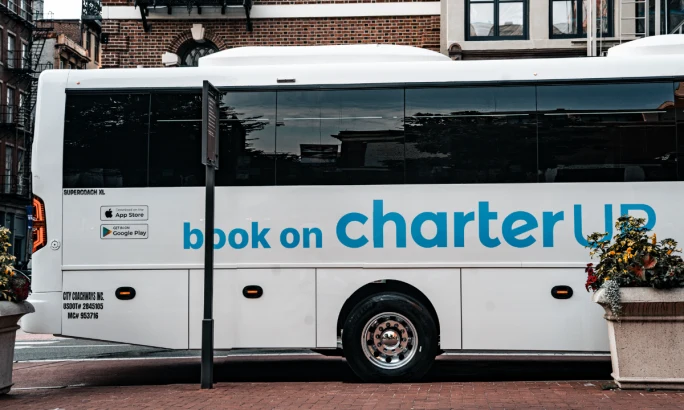
Addressing the technical ecosystem, Peter Gould, vice president of transit for CharterUP, emphasized that collaboration rather than competition defined the mobility network:
"Public transit was always the foundation. We weren’t there to replace it, but to fill the gaps where fixed-route transit wasn’t designed to operate… The biggest challenge was that every market had its own transit network and operational constraints. There wasn’t a one-size-fits-all solution."
Future Outlook: Mega-Events as Mobility Laboratories
Now that the final whistle has blown and the crowds have returned home, transportation authorities are left with a critical asset: comprehensive empirical data.
Federal investments played an instrumental role in seeding these capabilities. Earlier in the year, the Federal Transit Administration (FTA) announced a landmark $100.3 million investment in public transportation to support the 2026 World Cup across U.S. host cities, covering essential planning, capital, and operating expenditures. Building directly on this momentum, the FTA subsequently announced an additional $94.3 million in April to support public transportation preparations for the upcoming 2028 Olympic and Paralympic Games in Los Angeles.
Transit agencies and private operators now possess granular analytics detailing passenger boarding patterns, peak surge windows, transfer-hub stress points, and post-match evacuation velocities. These insights transform the World Cup from a transient sporting spectacle into a permanent mobility laboratory.
For major metropolitan networks like Los Angeles Metro, the lessons learned during the soccer tournament serve as an invaluable dress rehearsal for the Olympics. The integration of advanced dashboards—such as CharterUP’s Transit Intelligence Platform—alongside real-time multi-agency coordination between local police, federal transit officials, and private charter networks, has set a new benchmark for North American event logistics.
Ultimately, the true legacy of the 2026 FIFA World Cup’s transportation network will not be measured solely in record-shattering ridership numbers or sprawling revenue reports. It will be found in the quiet efficiency of a system that allowed millions of people to traverse international borders, complex metropolitan regions, and crowded stadium corridors without ever having to wonder how the pieces fit together.