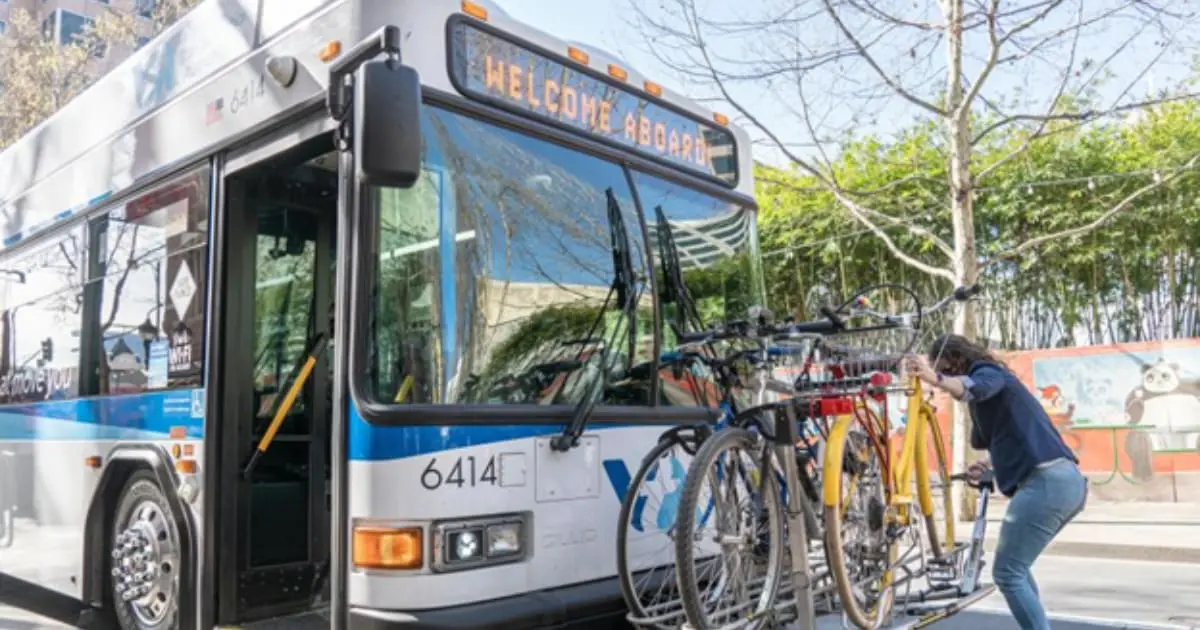
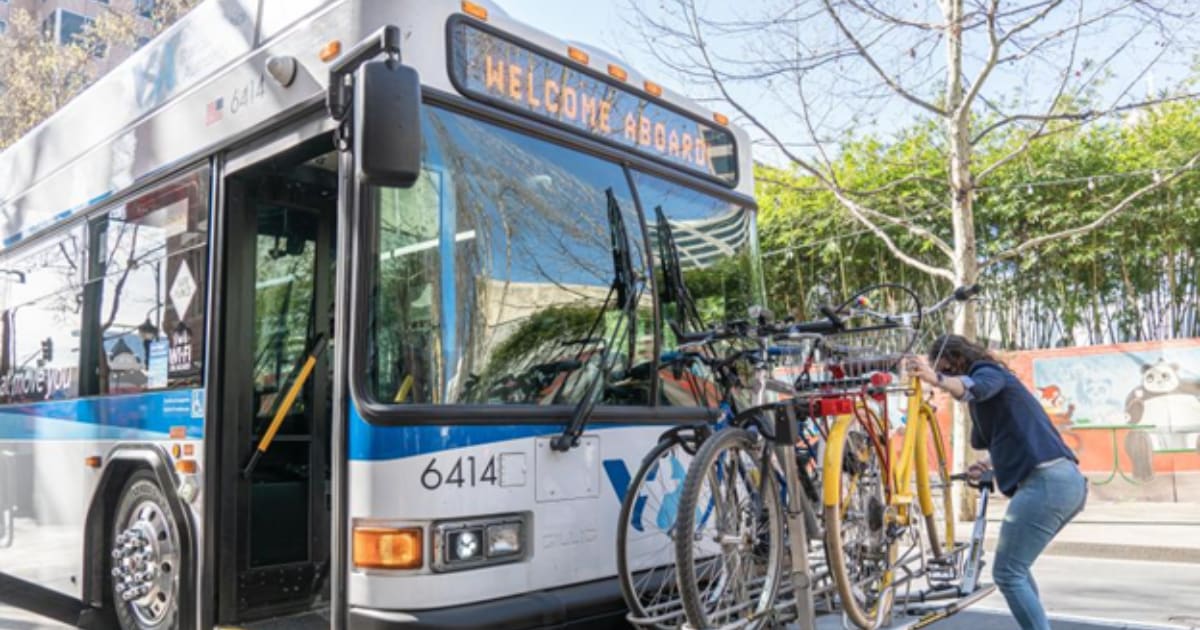
Every hour of every day, an average of more than 1,000 North American transit riders roll their bicycles up to the front of a bus, lock them securely onto exterior racks, and step inside. Over the course of a single year, this routine interaction accumulates into an estimated 9.1 million bike-on-bus trips across the continent. Yet, for decades, this massive wave of multimodal commuting has remained largely invisible to the very agencies operating the transit systems.
While public transit authorities routinely track metrics like on-time performance, farebox recovery, schedule adherence, and raw headcounts, the lifecycle of a combined bike-and-bus journey has long been obscured by a data blind spot. Historically, understanding bicycle demand relied on sporadic manual counts, operator guesswork, or passenger surveys—methods that yielded fragmented snapshots rather than an actionable, continuous picture of network utilization.
However, a paradigm shift is underway. A landmark white paper published jointly by WSP in the U.S. and Sportworks, titled "Making Multimodal Mobility Visible," details groundbreaking pilot programs with the Santa Clara Valley Transportation Authority (VTA) and the San Diego Metropolitan Transit System (SDMTS). By leveraging automated data-capture systems like Sportworks’ Velolink, these agencies are transforming ordinary bike racks into sophisticated data-gathering nodes.
The implications are profound. By integrating bike-on-bus metrics with traditional General Transit Feed Specification (GTFS) data, weather patterns, and passenger counts, transit planners are moving from a state of reactive guesswork to proactive, data-driven orchestration. This evolution allows cities to optimize vehicle fleet configurations, anticipate capacity bottlenecks ahead of major global events like the 2028 Summer Olympics, and identify hidden infrastructure gaps where a bus route is inadvertently serving as a high-frequency band-aid for missing urban bike lanes.
Detailed Chronology: Unveiling the Blind Spot in Modern Urban Transit
To understand how North American transit agencies arrived at this data intersection, it is necessary to examine the historical evolution—and persistent limitations—of how multimodal trips have been monitored.
The Era of Manual Guesswork
For generations, the integration of bicycles and buses was treated as a secondary amenity rather than a core structural component of the urban transportation network. Agencies installed mechanical racks on the fronts of their buses largely to comply with sustainability mandates or to appease active transportation advocates, rarely looking deeper into the operational telemetry of those fixtures.
When agencies attempted to quantify bike usage, they typically relied on two flawed methods:
Passenger Surveys: Annual or biennial questionnaires asking riders about their commuting habits, which notoriously suffer from self-reporting bias and low sample sizes.
Operator Logs: Requiring bus drivers to manually click a counter or write down every time a passenger loaded a bicycle.
This second method proved especially problematic. Bus operators are tasked with navigating complex urban traffic, maintaining schedules, enforcing fare policies, and ensuring passenger safety. Expecting them to reliably track every bicycle load during peak morning and evening rushes resulted in severely underreported numbers.
The Automated Revelation
The gap between perceived demand and actual usage became starkly apparent when automated data collection systems were first deployed in pilot environments. During initial evaluations by transit agencies utilizing modern sensor and telemetry tech, automated counts revealed that actual bike-rack usage was up to 80% higher than what manual operator tallies had previously indicated.
This staggering discrepancy exposed a critical vulnerability in transit planning: agencies were attempting to manage multi-million-dollar capital budgets and design comprehensive urban mobility networks while missing nearly half the picture of how riders actually navigated the first and last miles of their journeys.
Recognizing this disconnect, WSP in the U.S. and Sportworks initiated pilot studies with SDMTS and VTA. These projects sought to answer a fundamental question: What could urban planners do differently if they understood not just how many people boarded a bus, but how those riders connected to it in the first place?
Supporting Context & Metrics: Bridging the Gap Between Data-Rich and Data-Driven
The transportation industry is rarely starved for data. Modern transit buses are equipped with Automatic Passenger Counters (APCs), Automated Vehicle Locators (AVLs), electronic fare collection systems, and engine telemetry units, generating terabytes of operational data daily.
However, as transportation consultants emphasize, there is a yawning chasm between being a data-rich agency and a data-driven one.
The Anatomy of Fragmented Information
Armon Keshmiri, a fleet technology consultant, and Maria Signes-Costa Smith, an associate consultant at WSP in the U.S., note that the primary hurdle is not acquiring more data, but rather connecting disparate datasets in a way that generates actionable insights for planners and operators.
In a typical data-rich agency, data silos exist between departments:
Operations tracks vehicle location and schedule adherence.
Maintenance tracks mechanical wear and tear, including bus rack repairs.
Planning reviews ridership numbers to justify route modifications.
Active Transportation Teams advocate for bike lanes and secure parking structures without real-time metrics from the field.
When these datasets remain fragmented, their utility plummets. A high count of bicycle loads on a specific route means little unless it is cross-referenced with route frequency, time of day, passenger crowding levels, and historical weather conditions.
Turning Numbers into Action
When automated bike-counting technology—such as Sportworks’ Velolink system—is integrated with core GTFS feeds, the data transforms from a passive historical record into an active operational tool.
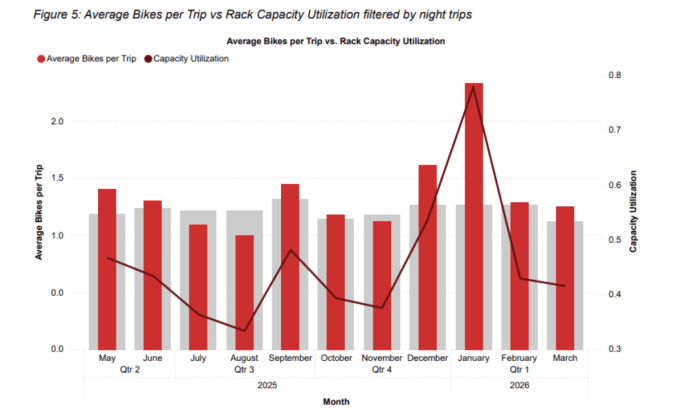
Consider the insights generated by the SDMTS pilot program, which tracked average bikes per trip alongside bike-rack capacity utilization during nighttime service hours. By filtering data by temporal and spatial variables, SDMTS was able to pinpoint specific corridors where night-shift workers or late-night university students frequently maxed out available rack capacity.
Without this granular visibility, an agency might cut late-night service due to overall lower passenger counts, inadvertently stranding multimodal commuters who rely on those specific trips to complete their journeys after local bike-share programs close or light rail shuts down.
Official Statements & Expert Perspectives
Industry leaders at the forefront of the WSP and Sportworks white paper emphasize that multimodal data is fundamentally reshaping capital investments, vehicle procurement, and urban infrastructure planning.
April Johnson and Yizhou Chen on Operationalizing Equipment
April Johnson, general manager at Sportworks, and Yizhou Chen, VP of digital and growth at the company, argue that physical transit assets must be re-evaluated as active data sources.
"A bike rack isn’t just a rack; it’s an unused source of data," Johnson and Chen note. "Data-rich agencies have the numbers. Data-driven agencies have turned those numbers into something that can be acted on immediately."
This immediate action extends directly into capital planning and vehicle procurement. For decades, bus specifications regarding interior wheelchair spaces, stroller configurations, and exterior bike racks were based on generalized minimum requirements or historical averages.
With route-level multimodal telemetry, procurement strategies change entirely.
"If an agency can see, route by route, how many riders are boarding with bikes versus wheelchairs versus strollers, capital planning stops being a guess and starts being a spec," Johnson and Chen explain.
Furthermore, this data enables innovative seasonal operational adjustments. For example, agencies managing fluctuating college town populations or tourist seasons could deploy seasonal "bike buses"—buses specially configured with expanded interior or exterior bicycle storage during peak cycling months, and traditional seating configurations during winter months.
Armon Keshmiri and Maria Signes-Costa Smith on Holistic Mobility
Echoing the need for a holistic view of the passenger journey, WSP’s Armon Keshmiri and Maria Signes-Costa Smith stress that transit cannot exist in a vacuum.
"The value of transit doesn’t exist in isolation," Keshmiri and Signes-Costa state.
They argue that the ultimate objective of collecting multimodal data is to evaluate how well the entire regional transportation network supports a rider’s complete door-to-door trip. By viewing bike-on-bus interactions through a spatial lens, agencies can identify not only where transit capacity is strained, but where the broader urban environment is failing active transportation users.
Future Outlook: Mega-Events, Predictive Analytics, and Infrastructure Insights
Looking ahead over the next five to ten years, the integration of multimodal mobility data is poised to revolutionize how cities prepare for massive cultural shifts, seasonal variations, and international mega-events.
Preparing for Global Megatrends and Events
The ability to capture real-time, route-specific bicycle demand will be indispensable for cities hosting large-scale international gatherings. Looking ahead to major events such as the 2028 Summer Olympic and Paralympic Games, transit agencies face the monumental task of moving millions of visitors who are unfamiliar with local transit networks.
By integrating Velolink data directly into GTFS-Realtime feeds, agencies can broadcast live bicycle rack availability directly into consumer-facing trip-planning applications (such as Google Maps, Transit App, or proprietary agency apps). If a visitor plans a trip involving a bus route with a fully occupied bike rack, the app can proactively suggest an alternative route or alert the user to secure temporary parking nearby.
This mirrors successful international frameworks, such as the multimodal strategies deployed during the Paris 2024 Olympic Games, which seamlessly combined temporary secure bike parking, expanded micro-mobility corridors, and real-time passenger information to disperse crowding.
Redefining the Problem: When High Bike Demand Tells a Different Story
Perhaps one of the most profound insights generated by the VTA "Wheels on the Bus" pilot was the discovery that high bike-rack utilization does not always point to a need for more transit capacity.
During the VTA study, analysts observed dense concentrations of bike-rack usage along a remarkably short segment of a specific bus route. At first glance, standard operational logic would suggest adding more buses or upgrading to larger racks to handle the surge in cycling demand.
However, spatial analysis revealed the underlying truth: cyclists were using the bus exclusively to cross a dangerous, high-speed freeway overpass that entirely lacked protected bicycle or pedestrian infrastructure. In this scenario, the bus was not acting as a traditional transit link, but rather as a mechanical bridge over an urban design hazard.
Armed with this insight, VTA’s planning department could re-evaluate its capital expenditure. Instead of continuously investing in heavier bus operations to solve a short-term bottleneck, the agency could collaborate with municipal departments to construct a dedicated pedestrian and bicycle overcrossing. The result is a more cost-effective, permanent infrastructure solution that frees up bus capacity for longer-distance transit commuters.
Conclusion: Starting With the Problem, Not the Technology
As transit agencies across North America grapple with evolving post-pandemic ridership patterns, constrained operating budgets, and ambitious climate action goals, the necessity of visibility into multimodal journeys has never been more urgent.
The white paper by WSP in the U.S. and Sportworks offers a clear roadmap for the future. True innovation in public transportation does not necessarily require agencies to instantly adopt expensive, unproven technology platforms. Instead, it begins by asking the right operational questions: Where do our riders come from? How do they complete their first and last miles? And what are our physical assets trying to tell us?
By transforming ordinary bicycle racks into intelligent data endpoints, transit agencies are shedding decades-old blind spots. They are moving from reactive firefighting to predictive planning—ensuring that every bus, bike rack, and transit stop works in absolute harmony to build a more connected, efficient, and resilient urban mobility network.