











Executive Overview
The global supply chain has spent the better part of the last few years operating under a state of perpetual adaptation. Amid fluctuating consumer demand, shifting geopolitical alliances, and severe environmental constraints on key maritime transit corridors, the primary gateways for North American trade have had to demonstrate unprecedented flexibility. Nowhere is this resilience more visible than at the Port of Long Beach.
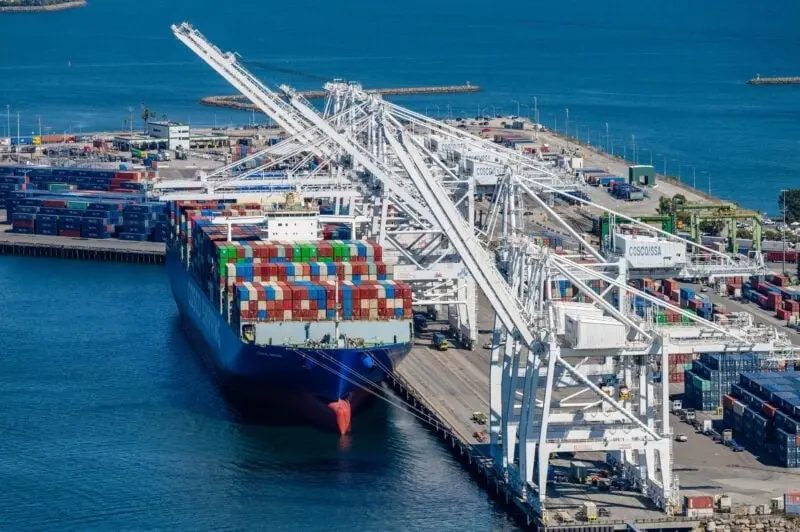
In August, the Southern California gateway handled its busiest August in its 115-year history. The port moved a staggering 919,992 twenty-foot equivalent units (TEUs), representing a 2% increase compared to the same period last year. This milestone marks the fifth-busiest overall month in the port’s history, defying earlier macroeconomic forecasts that predicted a sharp late-summer drop-off in import volumes.
This historic performance comes at a critical juncture for international trade. Rather than witnessing the traditional, highly concentrated "peak season" that typically crests in late summer and dissipates rapidly, the shipping industry is experiencing an extended, rolling peak. Driven by resilient U.S. consumer spending, proactive inventory hedging against impending tariff adjustments, and systemic disruptions at alternative ports of entry, shippers are increasingly routing their cargo through the reliable San Pedro Bay complex.
As the Port of Long Beach cements its status as a vital anchor of global commerce, its latest performance metrics offer a diagnostic look into the health of the American consumer, the strategic calculations of major retailers, and the shifting dynamics of global maritime logistics.
Detailed Chronology: The Evolution of the Peak Season
To understand the significance of the August record, it is necessary to trace the trajectory of trade volumes and expectations leading up to the late summer peak.
[Spring] Early Front-Loading Peak -> [July] Sustained Highs (2.3M TEUs National) -> [August] Long Beach Record (919,992 TEUs) -> [September] Projected National Peak (2.31M TEUs) -> [Oct/Nov] Projected Seasonal TaperingThe Early-Year Projections: Anticipating an Early Taper
At the start of the year, industry analysts, including those at the National Retail Federation (NRF) and Hackett Associates, anticipated a highly front-loaded shipping season. The consensus among supply chain strategists was that retailers, scarred by the supply chain crises of the pandemic era and wary of looming tariff hikes on Chinese imports, would pull their holiday and autumn inventory shipments forward into the spring and early summer months.
This strategy of "front-loading" was expected to hollow out the traditional late-summer peak, resulting in a muted August and September. Logistics providers prepared for a quiet end to the summer, expecting that warehouses would already be filled to capacity by July.
The Reality: Sustained Momentum Through August
Instead of tapering, cargo volumes remained elevated. The Port of Long Beach’s August throughput of 919,992 TEUs demonstrated that the appetite for imports had not been satisfied by early-summer shipments. This sustained momentum was driven by several overlapping factors:
- Persistent Consumer Demand: Despite persistent inflation and elevated interest rates, consumer spending on retail goods remained robust, forcing retailers to continually replenish their stock.
- Operational Diversions: Persistent drought conditions and capacity restrictions in the Panama Canal, combined with escalating security risks in the Red Sea, prompted ocean carriers to divert cargo away from East and Gulf Coast ports, redirecting volumes to the West Coast.
- The Southern California Advantage: With its extensive intermodal rail connections and massive warehousing footprint in the Inland Empire, the Port of Long Beach became the primary beneficiary of these rerouted cargo flows.
Supporting Context & Metrics: Analyzing the Inbound and Outbound Flows
A granular breakdown of the Port of Long Beach’s August performance reveals a complex picture of import-export imbalances and the logistical choreography required to keep empty containers moving back to manufacturing hubs in Asia.
+---------------------------+---------------------------+---------------------------+
| Metric Category           | Volume (TEUs)             | Year-over-Year Change (%) |
+---------------------------+---------------------------+---------------------------+
| Total Throughput          | 919,992                   | +2.0%                     |
| Inbound Imports           | 456,100                   | +3.6%                     |
| Outbound Exports          | 99,754                    | +4.0%                     |
| Empty Containers          | 364,138                   | -0.4%                     |
| Year-to-Date (YTD) Total  | 6,680,000                 | +1.3%                     |
+---------------------------+---------------------------+---------------------------+
Imports: The Primary Engine of Growth
Inbound loaded containers reached 456,100 TEUs in August, representing a 3.6% year-over-year increase. This surge in imports highlights the ongoing reliance of American retailers on East Asian manufacturing. The steady inflow of goods spans multiple sectors, including consumer electronics, home furnishings, apparel, and automotive parts.
Exports: A Modest but Crucial Gain
While imports continue to dominate the port’s operational focus, outbound loaded containers also registered positive growth. Exports rose by 4% year-over-year to 99,754 TEUs. This growth is a positive sign for domestic producers, particularly agricultural exporters in the Central Valley of California and manufacturers utilizing intermodal networks to ship goods to transpacific markets. However, the persistent gap between imports and exports—nearly a 4.5:1 ratio—underscores the structural trade deficit that characterizes transpacific commerce.
Empty Containers: The Logistics of Repatriation
The movement of empty containers slipped slightly, falling 0.4% to 364,138 TEUs. Managing the flow of empty containers is one of the most complex operational challenges for terminal operators. To maintain a fluid supply chain, ocean carriers must quickly repatriate empty boxes back to Asian manufacturing centers, where they can be reloaded with fresh imports. The slight dip in empty container movements suggests that terminal operators managed to balance equipment dwell times effectively, avoiding the severe yard congestion that has plagued West Coast ports during previous volume surges.
Year-to-Date Progress
Through the first eight months of the year, the Port of Long Beach handled a total of 6.68 million TEUs, representing a 1.3% increase compared to the same period in the prior year. This steady growth rate indicates that the port is on track to post one of its strongest annual totals on record, reinforcing its role as a premier gateway for transpacific trade.
Macroeconomic Catalysts and Global Disruptions
The record-breaking volumes at the Port of Long Beach cannot be viewed in isolation. They are the direct result of a highly volatile global macroeconomic and geopolitical landscape.
┌─────────────────────────────────────────────────────────────────────────┐
│                    GLOBAL SUPPLY CHAIN CATALYSTS                        │
├────────────────────────────────────┬────────────────────────────────────┤
│         Geopolitical Risks         │        Environmental Limits        │
│  • Red Sea security threats        │  • Panama Canal draft restrictions │
│  • Middle East / Iran fuel spikes  │  • China extreme weather delays    │
└────────────────────────────────────┴────────────────────────────────────┘
Geopolitical Friction and the Threat of Cost Inflation
The international shipping community continues to navigate a minefield of geopolitical tensions. Ongoing conflicts in the Middle East, particularly those involving maritime routes near Iran and the Red Sea, have introduced volatility into global fuel prices.
Higher bunker fuel costs directly translate to elevated ocean freight rates. Shippers, anticipating that these geopolitical disruptions could lead to sudden rate spikes or blank sailings, have chosen to secure space on West Coast-bound vessels early, preferring the predictable transit times of the transpacific route over more vulnerable lanes.
Environmental Bottlenecks and Infrastructure Constraints
Climate-related disruptions have also reshaped shipping networks:
- Panama Canal Restrictions: The Panama Canal, which serves as a vital conduit for goods moving from Asia to the U.S. East and Gulf Coasts, has faced operational challenges due to fluctuating water levels in Gatun Lake. While draft restrictions have eased somewhat, the lingering threat of renewed drought conditions has left logistics managers cautious, prompting many to shift their cargo permanently back to West Coast intermodal corridors.
- Monsoon and Typhoon Season in Asia: Severe weather events in China and Southeast Asia during the summer months led to widespread vessel delays and port closures. These delays disrupted weekly liner schedules, causing cargo to arrive in concentrated waves rather than a steady stream. When these delayed vessels finally arrived at Southern California terminals, they contributed to the concentrated volume spikes observed in August.
Official Statements and Port Leadership Perspectives
The port’s leadership attributes this record-breaking performance to operational readiness and the strategic trust that global shippers place in the San Pedro Bay gateway.
In a statement addressing the August volume figures, Port of Long Beach officials highlighted the facility’s ability to offer stability in an otherwise unstable global market.
"Our August numbers tell us that shippers continue to adapt to tariffs and geopolitical uncertainty and are confident in the Port of Long Beach’s ability to deliver," said Port of Long Beach CEO Noel Hacegaba. "The numbers also show that the Port is a safe and secure harbor that customers can count on."
Hacegaba’s comments point to a critical shift in how modern logistics managers select their ports of entry. In an era defined by "Just-in-Case" inventory management rather than "Just-in-Time," reliability, yard fluidness, and landside connectivity have become more important than ocean freight cost differentials alone. The Port of Long Beach has invested heavily in infrastructure—including on-dock rail projects, terminal automation, and digital supply chain visibility tools—to ensure it can absorb these sudden shifts in volume without experiencing crippling bottlenecks.
To provide deeper transparency to its stakeholders, the port’s executive leadership is scheduled to host its next Supply Chain Insight briefing on September 16. During this session, Hacegaba and other industry experts are expected to dissect the underlying operational data from August, provide updates on terminal capacity, and discuss strategies for maintaining fluid cargo velocity through the autumn peak.
Future Outlook: Navigating the Autumn Horizon
While August set historic benchmarks, the broader question facing the logistics industry is how long this elevated volume can be sustained.
Expected Import Volume Trajectory (National Port Tracker Forecast)
==================================================================
July:      ██████████████████████████████ 2.30M TEUs
September: ███████████████████████████████ 2.31M TEUs (Projected Peak)
October:   ███████████████████████████ 2.11M TEUs
November:  ██████████████████████████ 2.00M TEUs
The September Surge
According to the latest Global Port Tracker report, compiled by the National Retail Federation and Hackett Associates, the peak is expected to extend through September. The report projects September to be the busiest overall month of the year for major container ports across the United States, with volumes expected to reach 2.31 million TEUs.
If realized, this figure would represent a 9.6% increase compared to September of the previous year, slightly eclipsing the high-water mark of 2.3 million TEUs recorded in July. This forecast suggests that the late-summer momentum has carried over directly into the autumn shipping cycle.
The Looming Autumn Taper
Despite the strong performance projected for September, supply chain experts caution that a seasonal cooling is on the horizon. The Global Port Tracker anticipates that import volumes will begin to taper off as the holiday inventory is fully positioned on store shelves and in fulfillment centers:
- October Forecast: Expected to decline to 2.11 million TEUs.
- November Forecast: Expected to drop further to 2.00 million TEUs.
This expected decline represents a return to normal seasonal patterns, allowing terminal operators, drayage truckers, and warehouse workers an opportunity to clear accumulated backlogs before the post-holiday return cycle begins.
Full-Year Projections and Structural Resiliency
For the full calendar year, total import volumes across all ports covered by the Global Port Tracker are projected to reach 25.7 million TEUs, representing a modest but stable 1% increase over the prior year. This steady annual growth rate, achieved in the face of persistent inflation, elevated interest rates, and unprecedented geopolitical obstacles, is a testament to the fundamental resilience of the U.S. consumer economy.
As the maritime sector looks toward the end of the year, the Port of Long Beach’s record-breaking August stands as a clear indicator of its strategic importance. By providing a reliable, high-capacity gateway capable of absorbing global trade shocks, the port has not only secured its place in the history books but has also played a crucial role in keeping the wheels of global commerce turning during a period of profound global transition.