








Executive Overview
The global maritime supply chain is currently locked in a profound paradox. On paper, the global container ship fleet has never been larger, thanks to a historic wave of newly built vessel deliveries over the past two years. In practice, however, international shippers are facing acute space shortages, erratic schedules, and localized spikes in freight rates.
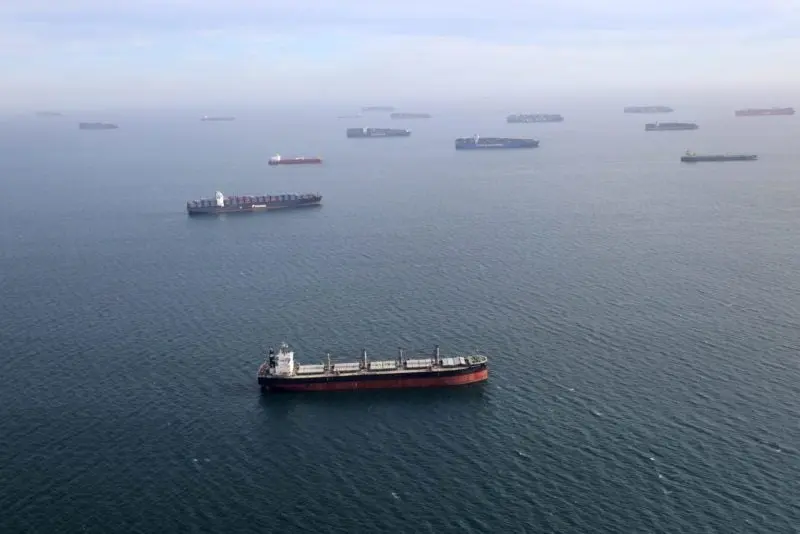
According to the October Edge Report published by global logistics provider C.H. Robinson, approximately 12% of the world’s container ship capacity is currently immobilized by port congestion. This represents the highest level of sidelined capacity in four years, echoing the severe logistical gridlock seen during the height of the pandemic-era supply chain crisis.
This bottleneck is not driven by a lack of physical vessels, but by a dramatic contraction in "usable capacity." A compounding mix of geopolitical diversions, severe weather events, labor imbalances, and carrier schedule-recovery tactics has trapped more than one-tenth of the global fleet in port anchorages and congested terminals. The impact is highly uneven, hitting critical trade corridors across East Asia, Northern Europe, and the Indian Subcontinent with varying degrees of severity. As the shipping industry enters the final quarter of the year, supply chain directors are being forced to pivot from analyzing headline fleet data to managing the day-to-day realities of stranded cargo and unreliable vessel schedules.

Detailed Chronology: The Confluence of Disruptions
The current gridlock is not the result of a single catastrophic event, but rather a slow-motion accumulation of systemic disruptions over the course of the year. To understand how 12% of the global fleet became trapped, it is necessary to trace the operational timeline and the compounding factors that led to this autumn peak.
+-----------------------------------------------------------------------------+
|                          CHRONOLOGY OF DISRUPTION                           |
+-----------------------------------------------------------------------------+
|  Late 2023 - Present: Red Sea Crisis                                        |
|  - Vessels divert around Cape of Good Hope, adding 10-14 days to transits.   |
|  - Schedule integrity deteriorates; initial vessel bunching begins.         |
+-----------------------------------------------------------------------------+
|                                      v                                      |
+-----------------------------------------------------------------------------+
|  Summer 2024: Weather Extremes & Transit Restrictions                       |
|  - Panama Canal draft restrictions limit Western Hemisphere transits.       |
|  - Severe typhoons strike East Asia, forcing temporary port closures.       |
+-----------------------------------------------------------------------------+
|                                      v                                      |
+-----------------------------------------------------------------------------+
|  September 2024: Pre-Golden Week Export Surge                               |
|  - Shippers rush cargo out of China before the Oct 1-7 holiday closure.      |
|  - Terminal yards overwhelm, causing severe container equipment deficits.    |
+-----------------------------------------------------------------------------+
|                                      v                                      |
+-----------------------------------------------------------------------------+
|  October 2024: The Recovery Dilemma                                         |
|  - Carriers implement reactive port omissions to maintain schedules.        |
|  - Stranded cargo piles up at transshipment hubs like Colombo and Singapore. |
+-----------------------------------------------------------------------------+
The Baseline Strain: Red Sea and Panama Canal Constraints
The foundation of the current capacity crisis was laid in late 2023 and early 2024. Ongoing security threats in the Red Sea forced the vast majority of Asia-Europe and Asia-US East Coast services to bypass the Suez Canal, opting instead for the longer journey around Africa’s Cape of Good Hope. This diversion immediately absorbed a massive portion of the global fleet, adding 10 to 14 days to round-trip voyages. Concurrently, severe drought conditions in Central America led the Panama Canal Authority to restrict daily vessel transits for months, further complicating trade flows to the US East and Gulf Coasts.
Summer Typhoons and Vessel Bunching
By mid-summer, these extended voyages had severely compromised schedule reliability. When ships do not arrive at their destinations at predictable intervals, they tend to arrive simultaneously—a phenomenon known as "vessel bunching." This issue was severely exacerbated in August and September by a series of powerful typhoons in East Asia.
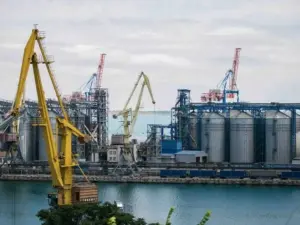
Major hubs in China, Taiwan, and Japan were forced to suspend terminal operations repeatedly. When these ports reopened, they were met with an overwhelming influx of delayed vessels, causing immediate yard congestion and forcing ships to wait at anchor for days to secure a berth.
The Golden Week Rush and the Port Omission Strategy
In September, the pressure reached a boiling point as Western importers rushed to secure space ahead of China’s Golden Week holiday (October 1–7), during which factories across the country shut down. In an attempt to get their vessels back on schedule for the post-holiday period, ocean carriers began implementing emergency operational measures, most notably port omissions.
Unlike a planned blank sailing—where a carrier cancels a voyage weeks in advance, allowing shippers to reroute cargo before it leaves the factory—a port omission occurs after the ship is already underway. To claw back lost days, a vessel will simply bypass a scheduled port of call, discharging its cargo at an alternative transshipment hub instead. This has triggered a massive backlog of stranded containers at intermediate hubs, setting the stage for the current Q4 gridlock.
Supporting Context & Metrics: The Logistical Math of Congestion
The operational reality of the current maritime market is defined by several key metrics that illustrate the scale of the bottleneck.
                      GLOBAL CONTAINER CAPACITY STATUS

    [████████████████████████████████████████████████████████████░░░░░░░░]
    ▲                                                            ▲
    0%                                                           88%    100%

    █ Active/Productive Capacity (88%)
    ░ Congestion-Sidelined Capacity (12%) - Four-Year High
The 12% Capacity Drain
With global container ship capacity estimated at roughly 29 to 30 million Twenty-Foot Equivalent Units (TEUs), a 12% congestion rate means that approximately 3.5 million TEUs of capacity are effectively sidelined. This volume is equivalent to removing the entire active fleet of some of the world’s largest ocean carriers from the market. This structural withdrawal of capacity has offset the deflationary pressure that the massive wave of new vessel deliveries was expected to exert on ocean freight rates.
The Port Omission Multiplier Effect
The operational difference between blank sailings and port omissions is critical for supply chain planning:
| Metric / Feature | Planned Blank Sailing | Unplanned Port Omission |
|---|---|---|
| Notice Period | 2 to 4 weeks before origin departure | Often 24 to 48 hours before arrival |
| Cargo Location | Remains at factory or origin warehouse | Stranded at an intermediate transshipment hub |
| Resolution Path | Booked onto the next scheduled weekly departure | Awaiting a secondary feeder vessel or alternative service |
| Supply Chain Impact | Predictable delay (typically 7 days) | Unpredictable delay (often 14 to 30+ days) |
| Equipment Impact | Minimal effect on empty container loops | Severe; empties are stranded far from export hubs |
When a carrier omits a port, hundreds of containers destined for that market are dumped at transshipment hubs like Singapore, Colombo, or Busan. These hubs, already operating near maximum capacity, quickly become congested. This slows down operations for all vessels calling at the port, creating a self-reinforcing cycle of delays.
Regional Bottlenecks and Trade Lane Divergences
The impact of this congestion is not felt equally across all global trade lanes:
- The Colombo Crisis (Indian Subcontinent): Colombo, Sri Lanka, has emerged as one of the most severely congested transshipment hubs in the world. Due to the Red Sea bypass, Colombo has become the primary gateway for cargo moving between India, Southeast Asia, and Europe. Terminal yards are operating at critical density, leading to missed connections and severe space constraints on India-North America services.
- The Trans-Pacific Squeeze: Ahead of Golden Week, space on Asia-to-North America routes tightened significantly. While blank sailings reduced effective capacity, the post-holiday period carries high rollover risks—where cargo is pushed to subsequent sailings—as Chinese factories resume production and attempt to clear the pre-holiday backlog.
- Asia-Europe Price Softening vs. Operational Delays: Interestingly, while Asia-Europe spot rates have softened due to the introduction of ultra-large container vessels (ULCVs), actual schedule reliability on this lane has plummeted. Shippers are paying less on the spot market, but they are facing highly unpredictable arrival windows.
Official Statements and Industry Insights
In its October Edge Report, C.H. Robinson highlighted the disconnect between headline fleet numbers and the operational reality on the water:
"Capacity may exist in the ocean network, but port congestion and steps the carriers are taking to get schedules back on track can change where and when that capacity is actually available."
The logistics provider emphasized that this lack of "usable capacity" is what is driving the current volatility, warning shippers that relying on global fleet growth statistics to negotiate long-term agreements could lead to supply chain disruptions.
Maritime analysts point out that the carriers’ defensive maneuvers—such as slow steaming to save fuel on the longer Cape of Good Hope route and skipping congested ports—are rational decisions for individual lines trying to maintain weekly service schedules. However, at a macro level, these actions aggravate the global container shortage.
When a vessel skips a port, it not only fails to deliver imports, but it also fails to pick up empty containers. This prevents empty equipment from being returned to Asian manufacturing hubs, creating localized container shortages in key export regions even as empty containers pile up in Western import terminals.
Future Outlook: Strategic Playbook for Shippers
The trajectory of the container shipping market through the fourth quarter of the year and into early next year will depend heavily on the strength of the post-Golden Week volume rebound.
+-----------------------------------------------------------------------------+
|                      Q4 MARKET REBOUND SCENARIOS                            |
+-----------------------------------------------------------------------------+
|                                                                             |
|  SCENARIO A: Robust Volume Rebound                                          |
|  - Strong consumer demand and inventory restocking continue.                |
|  - High port utilization persists, keeping the 12% capacity drain locked.   |
|  - Spot rates remain elevated; space guarantees require premium pricing.     |
|                                                                             |
|  SCENARIO B: Soft Volume Rebound                                            |
|  - Post-holiday shipping volumes experience a seasonal lull.                |
|  - Ports gain breathing room to clear backlogs and return empties.          |
|  - Sidelined capacity drops toward historical averages; rates normalize.    |
|                                                                             |
+-----------------------------------------------------------------------------+
Scenario A: Strong Volume Rebound
If retail demand in North America and Europe remains resilient, a steady flow of imports will keep port terminal yards highly utilized. Under this scenario, there will be no operational window for ports to clear their backlogs. The 12% capacity drain could persist or even worsen as winter weather begins to affect Northern Hemisphere shipping lanes, keeping freight rates elevated and space tight through the Lunar New Year in early next year.
Scenario B: Soft Volume Rebound
Conversely, if consumer demand cools, a temporary lull in shipping volumes could give congested terminals the breathing room they need to process backlogged containers and clear vessel queues. This would allow carriers to stabilize their schedules, reduce the frequency of port omissions, and return sidelined capacity to active service, leading to a gradual normalization of rates and space availability.
Tactical Recommendations for Global Supply Chain Leaders
Regardless of which scenario plays out, the era of predictable, just-in-time maritime logistics remains on hold. To mitigate the impact of the usable capacity crisis, logistics directors should implement the following strategic adjustments:
- Prioritize Port Selection Over Ocean Transit Times: When booking cargo, shippers should evaluate the congestion levels at both the origin and destination ports, rather than simply choosing the fastest ocean transit time on paper. Opting for secondary, less-congested ports can often result in faster end-to-end transit times, even if the ocean leg is longer.
- Minimize Transshipment Exposure: Given the severe gridlock at major hubs like Colombo and Singapore, shippers should prioritize direct-call services wherever possible. While direct strings may carry a rate premium, they eliminate the risk of cargo becoming stranded at an intermediate port due to a sudden port omission.
- Build Buffer Stock into Lead Times: Supply chain planning models must be updated to reflect the reality of deteriorated schedule reliability. Shippers should add a buffer of at least 14 to 21 days to their historical lead times for Asia-to-Europe and Asia-to-North America shipments to account for potential vessel bunching, port omissions, and terminal delays.
- Secure Multi-Carrier and Multi-Alliance Commitments: Relying on a single ocean carrier or a single shipping alliance increases vulnerability to localized disruptions. Diversifying bookings across different alliances ensures that if one carrier group experiences severe schedule disruptions or implements widespread port omissions, alternative transportation pathways remain open.